
Bullish Theory
November 16, 2006
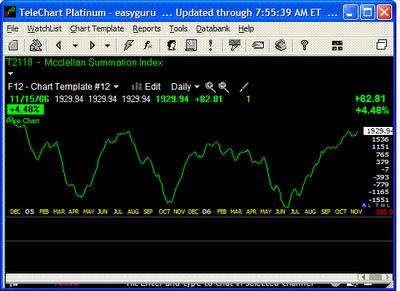
Update: Intra day basis the Index is showing 2000 plus with a reading of 2022.
Mcclellan Summation Index is at 1929 currently.
I am surprised with so many technical analysis junkies around why no one is focusing on this. It has one of the best logic behind it and considered very reliable by most technical analysts.
Mcclellan Summation Index is at 1929 currently.

Among the most significant indications given by the Summation Index are the identification of the end of a bear market and the confirmation of a new bull market. Bear markets typically end with the Summation Index below -1200. A strong rise from such a level can signal initiation of a new bull market. This is confirmed when the Summation Index rises well above +2000. Past examples of such a confirmation have resulted in bull markets lasting at least 13 months, with the average ones lasting 22-24 months.
Interpretation
The McClellan Summation Index is a long-term version of the McClellan Oscillator. Its interpretation is similar to that of the McClellan Oscillator except that it is more suited to major trend reversals.
As explained in the Calculation section, there are two methods to calculate the Summation Index. The two calculation methods create indicators with identical appearances, but their numeric values differ. These interpretational comments refer to the "suggested" calculation method explained in the Calculation section.
McClellan suggests the following rules for use with the Summation Index:
* Look for major bottoms when the Summation Index falls below -1,300.
* Look for major tops to occur when a divergence (page 29) with the market occurs above a Summation Index level of +1,600.
* The beginning of a significant bull market is indicated when the Summation Index crosses above +1,900 after moving upward more than 3,600 points from its prior low (e.g., the index moves from -1,600 to +2,000).
I am surprised with so many technical analysis junkies around why no one is focusing on this. It has one of the best logic behind it and considered very reliable by most technical analysts.
i am confused, so is this stuff saying that the bull market has yet to start?
ReplyDeleteYes. Post 2000 it confirms start of a bull market lasting at least 13 months. So all those who are bearish should be very cautious.
ReplyDeletejust curious, how do you describe the market when it hit recent lows in the summmer and rallied to present? if bull market hasnt started yet, i cant imagine what you call what has happened up to now...
ReplyDeletethanks
That was the appetiser, the main course is yet to follow. Significant bull markets involve PE exapansions. If you read the earnings trend, what they show is earnings have increased but price stagnated. So a PE expansion is the usual course.
ReplyDeleteI am sure it is not a very comforting thought for bears but that is how markets operate and most bull moves end with a bang.
If you are willing to consider the possibility of soft landing and the GDP dip as few quarter phenomenon and will be followed by GDP bouncing back then the alternative hypothesis is PE expansion.
Now all these are theories. I do not necessarily subscribe to them , but the point is there are many ways to look at the big picture. Some of the shrewdest and well respected analyst are talking about the PE exapnsion lead bull market for sometime.
gotcha, either way still all comes down to good stock selection, although i guess bull market can raise crap stocks too...
ReplyDeleteWhether you make 20% or 100% in bull market depends on stock selection. Only thing is once that index crosses 2000 just buy. Jokes apart see some of the William O'neil work on PE expansion.
ReplyDeleteThe theory goes something like what this guy is saying:
http://www.safehaven.com/showarticle.cfm?id=6301&pv=1
I have an open mind, lot of models which I follow like Boucher model, the Minervini model, and some others are indicated start of bull market. More importantly I see many things worth buying currently.