8/21/2018

Momentum Scans to make money

Momentum is stocks tendency to move in the direction of prevalent trend. You can use momentum to select stocks to swing trade or position trade.

Momentum can be calculated in many ways and the period and specific method used to calculate momentum depends on your goals and holding periods.

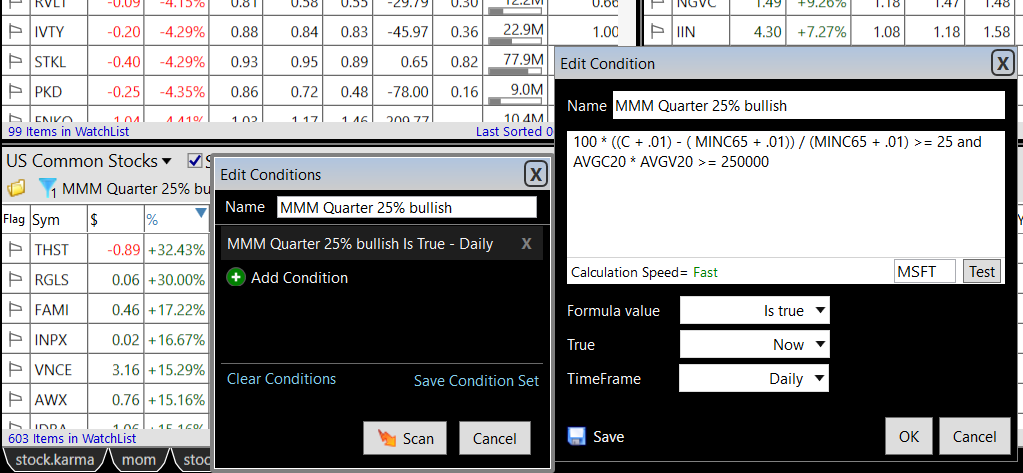
Momentum is often used to rank stocks and then top 25 or top 50 or top 200 stocks are selected for swing or position trades. This kind of momentum is relative momentum or relative strength.

Momentum can also be used to identify when a stock has entered momentum phase and when the momentum has ended. This kind of momentum is called absolute momentum.

Momentum based trading strategies have big advantage as they allow you to put your money to work in fastest moving stocks.

The momentum scans shared here can help you find momentum stocks on your own and profit from them.

In Telechart  you can create a layout with multiple momentum sort criteria. This kind of momentum sort allows you to rank stocks by momentum quickly.


YTD Momentum

This sort criteria comes in pre built in to Telechart. It finds momentum from 1st January to today. The scan parameters are:

100 * (C / C'12/31/2017' - 1)


MDT Momentum 

This is six month momentum ranking sort. It is useful for intermediate term hold and long term hold. 

c/avgc126

TI65 Momentum

This is 3 month momentum ranking sort criteria. It is good for finding swing trades opportunities. If you know how to use it profitably you can find thousands of trades in a year.

avgc7/avgc65

21 day momentum

 This is one month price percent change ranking. Short term momentum often mean reverts so this can be used to find extreme momentum moves vulnerable to reversal and you can fade them. It can also be used to find consolidations or pullbacks on recent big breakouts.

c/c21

10 day momentum

This is one 10 day price percent change ranking. Short term momentum often mean reverts so this can be used to find extreme momentum moves vulnerable to reversal and you can fade them. It can also be used to find consolidations or pullbacks on recent big breakouts.

c/c10


5 day momentum

This is one 5 day price percent change ranking. Short term momentum often mean reverts so this can be used to find extreme momentum moves vulnerable to reversal and you can fade them. It can also be used to find consolidations or pullbacks on recent big breakouts.

c/c5

One Year Momentum

Longer duration momentum moves can be used to find position trades. A stock with long term momentum can often spend months forming a base near top of its range , such stocks on high volume breakouts can go on to make further big moves.

c/c252

DT momentum

DT (Double Trouble) momentum sort is anchored momentum sort. It is based on the Darvas and Richard Love books . Itcalculates momentum from 52 week low. This kind of momentum is good for finding longer duration swing trades.

c/minl252

TI 42 Momentum

This is a 42 days momentum sort. It is used for mutual funds in 401k investing. 

100*avgc4/avgc42

All above scans are for ranking stocks. But many of these momentum indicators can also be used as absolute momentum indicator. The advantage of that is , it tells you when a stock has entered momentum phase.


Above chart shows TI65 Momentum used as absolute momentum . The Pink period indicates stock was in downtrend and when the downside momentum started and ended. Green portion tells you when the bullish momentum started. 

Absolute momentum is good for signalling trend transitions . The signal depends on period you use. If you are aggressive trader using faster signal will get you in early. Longer period momentum of 6 month is slower in identifying trend transitions but can help you avoid whipsaws.

Same MNK chart with MDT as absolute momentum indicator will show you that.


TI65 Absolute momentum Bullish

avgc7/avgc65>=1.05

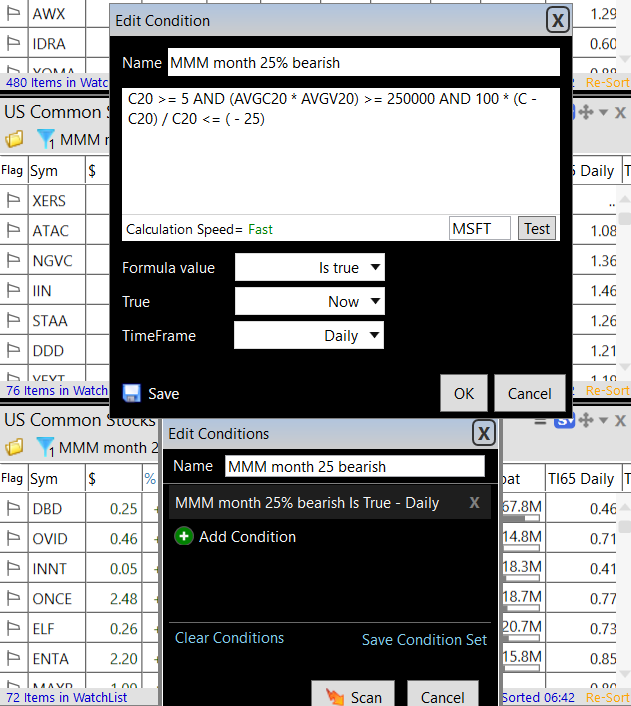
TI65 Absolute Momentum Bearish

avgc7/avgc65<=.95

MDT Absolute Momentum Bullish

c/avgc126>=1.19
 
MDT Absolute Momentum Bearish

c/avgc126<=.81

DT absolute Momentum Bullish

c/minl252>=1.80 


Once you understand momentum and nuances of using momentum you can find many creative uses to momentum. 

If you are serious about making money trading learn about momentum and how to use it to extract money from the market. Once you learn the details of momentum it is life long money extraction tool.

8/15/2018

Chinese Stocks might be due for a bounce

Most Chinese stocks look like they had climactic selling and reversal. If you are in to bottom fishing look at China stocks

China Stock List
BIDU HUYA BZUN HOLI WB NEWA ATHM YRD IQ MOMO YY NFEC ZNH NOAH FEDU QD BEDU CMCM AMBO BITA FAMI TOUR NTES XRF XNET WBAI GDS XIN SOGO KONE JD HTHT SINA DOGZ BSPM HNP CLDC EVK HX SSLJ LFC CHA PETZ BILI RETO UTSI DL AIHS CAAS ZLAB FTFT CALI PME OSN BCAC SMI JT JP SEED HPJ JASO COE CGA DSWL XNY GSUM ZXAIY YGEHY GLAC HGSH SPI CJJD SGOC CO BORN ITP LYL ALN KGJI SFUN JRJC YECO CCCL FENG SKYS AMCN UXIN TYHT RENN LITB CPHI GURE LKM PPDF GLG RCON TANH NCTY MOXC CCIH SOL SECO JMEI CBAK SVA LLIT EHIC CNTF SEII LEDS JMU HEBT CXDC YUMC ICLK CNET ABAC LEJU ATAI CEA HMI SSW FORK VNET JKS CTRP YIN CLPS TEDU DNJR TAOP GSH BRQS DELT CCRC CREG REDU VIPS KNDI PDD FFHL CCM LX ZTO ATV STG JG CADC CYOU NEW ZKIN PTR CIFS DQ SNP WUBA ONE TMSR SORL TAL ACH BSTI FANH SHI EDU KANG JOBS SOHU CANG AGMH GHG RYB HLG CBPO WINS

Market Monitor Scans

Market Monitor Scans : Version 1.1

All the scans used in Market Monitor Spreadsheet updated for latest version of Telechart.


Number of stocks up 4% plus today


Number of stocks down 4% plus today


Number of stocks up 25% plus in a quarter


Number of stocks down 25% plus in a quarter


Number of stocks up 25% plus in a month


Number of stocks down 25% plus in a month


Number of stocks up 50% plus in a month


Number of stocks down 50% plus in a month


Number of stocks up 13% plus in a 34 days


Number of stocks down 13% plus in a 34 days


Market Monitor Layout


8/10/2018

Big ideas around which you can develop trading setups

If you want to trade the market find the "big" basic and structural tendencies of the markets and build your setups around them.

A structural tendency of market is some kind of observed behavior of stocks that repeats .
For example stocks with surprisingly good or bad earnings tend to go up or down for several days post announcing such earnings . It is called PEAD (post earnings announcement drift). This is proven phenomenon across world market and has persisted since market came in to existence.
Now knowing this can give you big edge if you can convert it in to tradable setups. Doing this alone can make you millions.
Find similar structural tendencies of stock market and you will have found key to making money in good or bad time.
The structural tendencies of stocks give you a process oriented solution to finding opportunities. If you select the right kind of market structure to focus on you increase probability of success in the long run (there still will be periods when your structural phenomenon may not work due to some change in market structure or your own failure as a trader to exploit that , but in both cases it is a fixable issue.

Sooner you find an exploitable big ideas in your trading career better it is as it will save you time , frustration and money.

Here are some "big structural tendencies of stocks"

momentum

It is the inherent tendency of stocks to move in direction of pre established momentum. Study this in detail and you will find many ways to make money. Over last 18 years momentum has made me millions. It is one of my favorite big idea.
TI 65 MTD DT TI30 Anticipation $ and 4% b/o are all based on momentum

earnings

Earnings are the lifeblood of any enterprise. Stocks with good earnings outperform in short term as well as long term. There are many exploitable trading setups you can build around earnings. Earnings Episodic Pivots is one such setup I have traded very successfully for last 18 years. In last few years I have added more earnings related setups to the mix.
NTRT and EP setups are based on this

volatility cycles

Stocks go through phases of volatility contraction followed by expansion. During volatility contraction period stocks have series of range contraction days. If you can identify and exploit such periods it gives you very low risk entry in a explosive move. The anticipation setup I trade is based on this :big " idea. There are many other ways to trade same thing.
There are many many ways to trade this structural tendency. Once you study this you will find ways to make money with very little drawdowns.
Anticipation is one way to use this

Mean Reversion

Extreme strength or weakness tends to mean revert in short time frames. This tendency of markets is used by several mechanical traders to design automated strategies.
In all backtests these kind of systems work well.
BTFD Country in trouble RSI2 are some examples of mean reversion setups

growth investing

Growth stocks make some of the most explosive moves in the market. New businesses , new ideas, new segments are constantly created in the world. Stocks with above average growth in profit and sales can make dramatic moves in short period of time. As a trader if you develop a setup to exploit this tendency you can grow your account aggressively. The IBD based scans and setups I have shared are based on growth as "big " idea.

value and turnaround

Stocks that are cheap for variety of reason can often make big moves once market perception about them changes. Value investors have exploited this structural tendencies for centuries and this is proven structural tendency of market. If you research this approach you will find many ways to make money from value stocks. I do not trade any value based method or setups as I find enough ideas in momentum and growth.

technology stocks

Ever since markets were invented one sector has always stood out : technology. Nature of technology changes but new technology stocks outperform all other sectors in any market cycles. Focusing on technology stocks and especially getting early on to a new technology will help you make big money. If there is only one industry or sector you want to focus on . focus on technology.

biotechnology

Some of the biggest winners every year are biotechnology stocks. Investing in biotech is risky but highly lucrative. Biotech stocks have highest probability of making 300% plus moves in shortest time period , sometime in days or weeks. There are special skills and knowledge required to trade them , but if you can build that skill you can make ton of money.

China and Latin America

These two sectors tend to produce big winners . Tracking them separately can help.

all these are examples of big ideas which if you invest 6 month or a year you can build long term profitable career.

If you are serious about making millions trading , focus on these big ideas.

How to scan for anticipation setups

Anticipation Setup Scans: Bullish and Bearish

These scans should give you around 600 to 800 A quality anticipation
setups in a year once you know what to look for in a good setup


Bullish Anticipation Scan


Liquidity: minv3.1>=100000


TI65: avgc7/avgc65>1.04


Price Percent Change Today: between -.4 to .4(this is pre designed scan on TC2000)


Price History Net cange: between  -.2 and .2 (this is pre designed scan under PRICE in TC2000)


Price History: greater than 3


Bullish Anticipation IPO Scan


IPO: watchlist created by sorting Universe by DT criteria and
selecting stocks with less than one year data. DT scan c/minl252


Liquidity: minv3.1>=100000


Price Percent Change Today: between -1 to 1 (this is pre designed scan on TC2000)


Price History Net cange: between  -.2 and .2 (this is pre designed scan under PRICE in TC2000)


Price History: greater than 3


Bearish Anticipation Scan


Universe: watchlist created by putting US stocks+ Americon Depository Receipts+ ETF
in one personal watchlist


Liquidity 300: minv3.1>=300000


TI65: avgc7/avgc65 less than .95


Price Percent Change Today: between -1 to 1 (this is pre designed scan on TC2000)


Price History Net cange: between  -.4 and .4 (this is pre designed scan under PRICE in TC2000)


Price History: greater than 15


Bullish and Bearish 39 dollar plus price
Anticipation Scan


Universe: watchlist created by putting US stocks+ Americon Depository Receipts+ ETF
in one personal watchlist


Liquidity 300: minv3.1>=300000


Price Percent Change Today: between -.4 to .4 (this is pre designed scan on TC2000)


Price History Net cange: between  -.2 and .2 (this is pre designed scan under PRICE in TC2000)


Price History: greater than 39


TI65: avgc7/avgc65 betwee. .95 to 1.05


Anticipation setup is highly profitable setup and requires just 15 to 30 minutes
of efforts after close depending on your skill level.

8/09/2018

Use these breakout scans if you want to make money

The breakout scans I use to make money. I run them from market open onwards.

4% bullish Breakout

c/c1>=1.04 and v>v1 and v>=100000


$ bullish breakout

c-o>=.90 and v>100000


Bullish Low threshold b/o

minv3.1>=100000 and c>=3 and avgc7/avgc65>=1.05
and c>o and c>c1 and c/c1>c1/c2 and c1/c2<1.02


4% bearish Breakout

c/c1<=.96 and v>v1 and v>=100000  


$ bearish breakout

o-c>=.90  and v>=100000 and minv3.1>=100000


Bearish Low threshold b/o

c1/c2>=.98 and c/c1<c1/c2 and c<c1  AND C<O and minv3.1>=300000 and c>19 and avgc7/avgc65<.95


Breakouts is one of the type of setup I use. Anticipation and first 30 minutes explosion are other setups I use.

Together these scans work for me and in first six month of 2018 made me 56% returns. There is nothing special about these scans , it is the execution and day to day process of using them that requires persistence. 

Creating a winning mindset

To extract money from the market years after years you need a good setup and winning mindset. Challenge for many traders is to have a sustained winning mindset when market often frustrates you.

Winning mindset comes from having confidence in your own market understanding and setup . Winning mindset also comes from your track record of creating new setup ideas as market changes or your own understanding of market increases.

How can a struggling trader develop winning mindset before he or she gives up. Lot of it to do with finding success and shortening your learning curves. Building your trading approach around commonly used and proven setups by other successful traders is one of the better approach to do this.

I would recommend any new trader or struggling trader to build your approach around momentum. Momentum has been the most persistent tendency of stock. By focusing on momentum you are focusing on stocks being favored by the market at current moment.

The other important contributor to developing winning mindset is the nature of your belief systems and how firmly they are held. Beliefs drive behaviour and if we have right beliefs then right behaviour is an outcome of that belief.

Beliefs about how market works or how traders make money largely determine your trading behaviour.

Let us say if you hold a deep belief that "biggest winning stocks have good earnings and sales" , that belief would lead you to scan for stocks with those characters and trade them. Now because of this belief you will eliminate stocks that might be bigger winners than stocks with "best earnings and sales".

Unless you change your belief you will find it difficult to trade many profitable methods. Many traders have a belief " only way to make money is by holding for long term". That belief dictates their behaviour and it closes them to look at alternative reality of swing trading .

There are many such belief traps when it comes to entries , exits , where to put stops and where to exit. Sum total of those beliefs determine your trading . If you are struggling to make money currently it is the fault of some of those deeply held beliefs and not necessarily markets.

But it is easy to fix that problem. With few mindset shifts, better setups, strategies, and process you can get the trading results you are hoping for. 

8/07/2018

Night Time is Right Time to find big winners


News catalyst can often trigger big moves. Earnings is the number one stock mover. Earnings are released after hours and pre market.

A massive earnings surprise on a stock with multi month base can lead to big rallies lasting weeks or months.
Focusing on "massive Earnings acceleration " will help you find 5 to 20 big ideas in a year that can make 50% to 1000% move.
In order to find such massive acceleration you need a structured approach to track after hours earnings news.
It should be efficient process which should only take 15 minutes...

How many of you would want to spend daily 15 minutes to find potential 50% to 100% move????

In order to do this successfully you need very streamlined process. If you just tracked these handful of links you should be able to find big winners periodically.
  1. Zacks Earnings : https://goo.gl/CsJviq
  2. Seeking alpha earnings news https://goo.gl/zkAKiB
  3. Earnings whisper calendar https://www.earningswhispers.com/calendar
  4. Earnings Whisper email summary : you need to sign up for this . it is free
  5. WSJ post market winners https://goo.gl/9ZYmW7
A blowout earnings stock will not be missed if you do this daily.
Besides earnings news other news can also move stocks , but earnings will give you most bang for bucks for your 15 minutes.

Stocks to watch based on last night earnings reaction:

TWLO HEAR ETSY WTW Z