11/30/2010

Keep drawdowns small

alt text

In my beginning trading years my account graph looked like the second line and now it looks like the top line. I would run up account big and then end up giving up 40 to 70% open profit before realizing trend change . It is very difficult way to trade emotionally and in real term because you need to make triple digit gains to recover from deep drawdowns.
Loss of account (%) Gain to recover (%)
5                                5.3
10                              11.1
15                              17.6
20                              25.0
25                              33.3
30                              42.9
35                              53.8
40                              66.7
45                              81.8
50                            100.0
55                            122.0
60                            150.0
This was the same problem I faced in the beginning years.Many times I would run my account up double digit in few weeks and then end up giving back that profit. I did some serious thinking about this issue and retooled everything. The key things which I changed was:
+Developed Market Monitor which tells you risky zones. Bulk of the losses happen when there is a regime change. MM shows you such zones.
+Started looking for shorter swings. Earlier I would sit through correction thinking the stock had more upside. Now I get out before correction develops.
+Partial profits. This most swing traders will tell you is key. Ultimately all swing traders arrive at this solution after trial and error. It is not optimal solution when people back test it, but it very practical solution. By selling in units you reduce chances of giving back profits. (I know it reduces overall trade profit, hey but objective is to make money not to adhere to some back test theory)
+Setting profit target. I am always thinking of how much the stock will move when I am entering. To arrive at profit targets I keep looking at MM data . It tells you what are possible targets on stock. It also tells you when you should get out. If probability of stock making 25% or 50% move in the market in a month is known to you through MM history  then you know how to manage that trade and exit at right time.
+Vary risk. Some ideas are better than others and having the guts to bet big  on them can help a lot. Most ideas I bet .5 to 1% but once in a while you see a compelling trade where all ducks are lined up and then I bet big. But those big bets are not wild bets, but based on some logic. If I am up 75% plus for a year then betting 5% on a high conviction idea is not going to break the bank. Typically I make big bets only once I am up 20% plus for a year. So If I am up 20% plus I don't mind betting 2% on a idea. At 50% profit I do not mind betting 5% on a idea. 
+If a stock dos not work as anticipated after entry get out. No matter how good the story is if it does not act right get out. Seldom allow stock to hit stop. A good breakout has immediate follow through. If you have done a good job of selecting your stocks to trade and done good job of identifying good buy point then that trade should work immediately. 
+Everyday think profit protection once up 10% plus in a month. If I have big profits I have trained myself to not start thinking of buying Caribbean island but to start thinking of how to protect gains. The objective of trading for me is to make money and keep the profit. 
+When not sure sell first and ask questions later. Do not sit like a dead duck.
These are some of the things which have helped.
But I am also human and sometime there is loss of situational awareness and end up giving up some open profit or falling in love with a stock and not following my own rules. If you see this year all the big loss making trades have been on stocks which I had higher conviction and did not sell at proper sell point but only in two trades the losses exceeded more than 10% and the max loss on any trade was 12.28%. On overwhelming number of  losing trades the losses were below 5%. Cutting losses quickly is the cornerstone of my method and thinking. 10% loss is my uncle point.
One of the things about trading is there are no perfect solutions to your problem but one can find workable solutions. And real trading is messy. That is why many traders do not show their real time trades and P&L. While most people are looking for perfect answers. They are looking for method that will only have profitable trading. That will have perfect stops. And so on, but that is not how real discretionary traders operate.
Your first goal in trading should be to manage drawdowns. You should constantly work to have small drawdowns, yet have explosive returns. That requires some serious thinking.

Horses, donkeys, and camels

IBD says buy horses and sets out detailed rules for identifying good horses and when to to buy them . I am going through the IBD Level 1 and Level2 courses DVD currently and there are rules within rules for selecting stocks, buying them and exiting them. But between what IBD says is its method and what people actually understand it is and then actually do is two different things.
IBD says buy horses, people buy donkeys or camels using IBD method as they don't understand it completely.
That is not IBD problem.
That is true of any method. Between what a method actually says  and what people understand and what they actually do there is lot of comprehension gap. That is why most IBD traders take 5 to10 years to be successful with it.
Any method has basic concept but besides that there are hundreds of nuances and to completely comprehend and internalize those things take time. In many cases you need to experience a complete bull and bear cycle to understand and gain confidence in a method. Just trying a method for few weeks or months does not lead you to becoming competent trader.
There are many ways to profit in the market, you can use value, momentum, growth, mean reversion, statistical patterns, events, sentiments, insider trading, short ration and hundred other things to build a profitable trading method, but everything boils down to getting in to significant detail of the method and understanding nuances
To find good horses first you need to understand the difference between horses, donkeys, and camels.

11/29/2010

11/26/2010

Making momentum work

Last week we looked at how research shows that momentum is the most persistent tendency in the market. See my post How to Make Money Using Momentum  for more details on it. 
As a trader on a practical level you need to translate that momentum research in to trading profits. That is where the rubber meets the road. How can you design ways to exploit the momentum effect. For that you need to study different approaches used by traders. Over next series of posts I will highlight some of the ways traders use momentum to extract profit from the market.
Mark Boucher in his book details his Momentum/ Relative Strength based system for trading the world markets, the commodities, and the stocks. At the heart of his equity selection method is momentum. He use a weighted average Rate of Change or ROC to rank stocks. He offers two methods for equity selection based on whether you are long term traders or short term traders.
For Long Term Traders
( (2 * C * 100 / C5) + (2 * C * 100 / C25) + (2 * C * 100 / C40) + (2 * C * 100 / C65) + (C * 100 / C130) + (C * 100 / C195) + (C * 100 / C260)) / 11
He advises taking top 20% stocks ranked by this kind of ROC scan.
For Short Term Traders
( (2 * C * 100 / C5) + (2 * C * 100 / C25) + ( C * 100 / C40) ) / 5
He advises focusing on top 20% stocks by this kind of ROC scan.
After first using relative strength to narrow the universe of stocks, he uses earnings and other fundamental criteria to narrow this universe. Within that narrower universe he uses a Runaway Pattern criteria "TBBLBG" , which stands for Thrust Breakout (TB), Breakaway Lap (BL), and Breakaway Gap (BG).
Thrust Breakout (TB): The low of the Breakout Bar is higher than the low, but below the close of the preceding bar.
Breakaway Lap (BL): The low of the Breakout Bar is higher than the close, but below the high the preceding bar.
Breakaway Gap (BG): The low of the Breakout Bar is higher than the high of the preceding bar.
The selected stock must have five or more Runaway patterns(TBBLBG) in a 21-day period. After that he enters on a breakout from 20 day or more consolidation.
So in summary he uses a momentum based criteria as primary criteria for equity selection and uses fundamentals and technical patterns as secondary criteria to further narrow down the trading opportunities.

11/24/2010

Why you should not rush to buy a IPO on first day

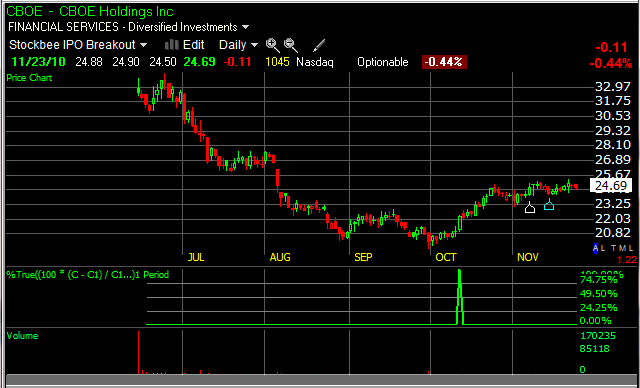
Buying IPO in after market on first day is suckers bet. Recently people rushed to buy GM . Here is what happened.


I have detailed how to trade IPO's in the Stockbee IPO Trading Guide. The rush to buy IPO on first day in after market by some retail investor is often a foolish bet. Most of the time the strategy is likely to fail. There is very good reason for that. IPO's are allocated to select few funds and individuals. They waste no time in flipping them and selling them in open market once the IPO opens for trading.

The new issue fizzle is a well known phenomenon. There is substantial and overwhelming evidence that shows that IPO under perform the market both in the short run and long run. This is extensively documented fact but Wall Street underwriters would like you to believe that investing in IPO's is good strategy. After all their business depends on finding bag holders for failed IPO's.

Very few IPO's make it over the long run, most fizzle out. How many IPO's from dot com era have survived. How many IPO's from housing boom era have survived? How many IPO's from the ethanol mania phase have survived.  IPO's are like fads they last for short period of time.

There is a sure shot way to make money on IPO if you can get the shares at offer price. Offer price is the price set by underwriters and issuing company for IPO before it starts trading. Research shows that on an average a IPO is 15% under priced. Research shows that over last 15 years, the share price of a typical  IPO rose 15% on first day of trading from offer pricejcboe.

Flipping an IPO is virtually free money for big institutions, select few wealthy individuals, hedge funds and Wall Street insiders. You need a fat account running in multi millions with leading broker like Goldman Sachs, Merrill Lynch, Morgan Stanley, Credit Suisse etc to be part of this money making racket.

Underwriters of IPO systematically under price IPO to make it easier for them to market the IPO and lower their risk to minimum. Under pricing assures that issue will be fully subscribed and the underwriting firm will not have to support the issue. If issue fails underwriters have capital loss.

In practice what this means is those lucky enough to get IPO shares at offer price quickly sell their holding on first day.This depresses the price post IPO. If you understand this you will understand that in vast majority of cases buying IPO in open market on first day is the most foolish thing you can do (but there was a period when the strategy worked it was during dotc com boom).

Unless the market is in mania stage buying IPO on first trading day has no edge. The typical path most IPO will follow post IPO is slow bleed as the IPO's are passed on from sophisticated investors to unsophisticated bag holders. Hot IPO's where investors think they are sure bets tend to perform the worst after IPO. Remember when CBOE IPO came it was touted as very hot IPO. What happened post IPO?


Wait for an IPO to setup after debut. Let the flipping phase be over and then you can find opportunities in IPO when they breakout after forming a base. GM will set up after few days or weeks and might offer a buy opportunity. But rushing to buy it on first day was not necessary. But marketing hype is hard to resist and people do not want to follow good advice and tested methods. Waiting for setups is hardest thing to do for many people.


POPULAR POSTS

11/23/2010

Stocks up 25% plus in a month


89 stocks are up 25% plus in a month from the database I monitor. AERL, CSII, and TSLA are the three biggest winners.


AERL,Asia Entertainment & Resources Ltd
AFFY,Affymax Inc.
AHD,Atlas Pipeline Holdings LP
ATLS,Atlas Energy Inc
ATML,Atmel Corp
AXTI,Axt Inc
BEXP,Brigham Exploration Co
BJGP,Bmp Sunstone Corp
BKE,Buckle Inc
BUCY,Bucyrus International Inc
CCIH,ChinaCache International
CEVA,Ceva Inc
CHNR,ChinaNatural Resources
CML,Compellent Technologies` Inc.
CPWM,Cost Plus Inc California
CSII,Cardiovascular Systems Inc
CSTR,Coinstar Inc
CVU,Cpi Aerostructures Inc
DECK,Deckers Outdoor Corp
EDMC,Education Management
EGY,Vaalco Energy Inc
ENTG,Entegris Inc
FFIV,F5 Networks Inc
FMR,First Mercury Financial Corp
FWLT,Foster Wheeler Ltd
GGAL,Grupo Financiero Galicia
GGS,Global Geophysical Services
GNET,Global Traffic Network Inc
GTLS,Chart Industries Inc
HL,Hecla Mining Co
IDT,Idt Corp Cl B
IDT.C,Idt Corp
IGTE,Igate Corporaion
IMAX,Imax Corp
IO,Ion Geophysical Corp
IPGP,Ipg Photonics Corp
IVAC,Intevac Inc
JAZZ,Jazz Pharmaceuticals Inc
KEM,KEMET Corp
KFFG,Kaiser Federal Financial Group
LAD,Lithia Motors Inc Cl A
LDSH,Ladish Co Inc
LORL,Loral Space & Communications Inc
LVS,Las Vegas Sands
MIPS,Mips Technologies Inc
MOTR,Motricity Inc
MPAA,Motorcar Parts of America` Inc.
MWW,Monster Worldwide Inc
NCTY,The9 Limited
NG,Novagold Resources Inc
NGD,New Gold Inc
NOR,Noranda Aluminum Holding Corp
NOV,National Oilwell Varco Inc
OII,Oceaneering Internat
PKOH,Park-Ohio Holdings Corp
PNCL,Pinnacle Airlines
PUDA,Puda Coal Inc
QCOR,Questcor Pharmaceuticals
ROSE,Rosetta Resources
RP,RealPage` Inc.
SFI.D,iStar Financial Inc-Preferred
SFI.E,iStar Financial Inc-Preferred
SFI.F,iStar Financial Inc-Preferred
SFI.G,iStar Financial Inc-Preferred
SFI.I,iStar Financial Inc-Preferred
SFLY,Shutterfly Inc
SGY,Stone Energy Corp
SHOR,ShoreTel` Inc.
SHS,Sauer-Danfoss Inc
SLW,Silver Wheaton Corp
ST,Sensata Technologies Holding N.V.
SURW,Sure West Communications
SVR,Syniverse Technologies
TDSC,3d Systems Corp
TGA,Transglobe Energy Corp
TNAV,TeleNav Inc
TORM,TOR Minerals International Inc
TSLA,Tesla Motors Inc
TTMI,Ttm Technologies Inc
UEIC,Universal Electronics
VDSI,Vasco Data Security Intl
VOCS,Vocus Inc
VRUS,Pharmasset Inc
VSH,Vishay Intertechnology
WNR,Western Refining Inc
WTI,W & T Offshore
WWWW,Web.com Group Incorporated
XCO,EXCO Resources Inc
XIDE,Exide Tech

11/22/2010

How to make money using momentum

Momentum investing looks for stocks rising faster than the overall market. Or in simple language it looks to buy strength and sell weakness.
Momentum has been extensively studied and studies show that stocks with the best price performance over the previous 3-12 month period tend to continue to outperform the market over the subsequent 3-12 month period while previous losers tend to continue underperforming. The most celebrated study in the academic literature which documented this phenomenon was by Jegadeesh Narasimhan and Sheridian Titman in a study titled "Returns of buying winners and selling losers
Jegadeesh, Narasimhan & Titman, Sheridan, 1993. " Returns to Buying Winners and Selling Losers: Implications for Stock Market Efficiency,Journal of Finance, American Finance Association, vol. 48(1), pages 65-91, March.
This paper documents that strategies that buy stocks that have performed well in the past and sell stocks that have performed poorly in the past generate significant positive returns over three- to twelve-month holding periods. The authors find that the profitability of these strategies are not due to their systematic risk or to delayed stock price reactions to common factors. However, part of the abnorm al returns generated in the first year after portfolio formation dissipates in the following two years. A similar pattern of returns around the earnings announcements of past winners and losers is also documented.
Since then this phenomenon has been studied in detail and it has been shown that this works across markets and is persistent in spite of it being known to market participants for years. General belief in market is if things are known they stop working.
In simple terms what these studies did was to take the entire universe of stocks in a given market and calculate returns over last 3 or 6 or 12 month period for all stocks. Then they ranked this stock universe by returns and separated 10 groups ranked by returns A zero cost portfolio of the top 10% stocks was created and held for 3 or 6 or 12 months and returns studied over the years. They found that the returns of the portfolio of top 10% stock was higher than that of next 10 to 20% and the return of next 10 to 20% was higher than 20 to 30% and so on for given holding period and the last group of stock in ranking had negative return. The top 10% stocks portfolio outperformed in returns in next 3 or 6 or 12 months over all the rest of the stock. Research also shows that this trend reverses after a 2-3 year holding period. Research also shows that in the shorter holding periods of 1 month, past 1 month winners do not show this tendency.
Top Research Papers About Momentum
  1. CHAN, L., N. JEGADEESH and J. LAKONISHOK, 1996. Momentum Strategies. NBER Working Paper. Cited by 297
  2. GRINBLATT, M., S. TITMAN and R. WERMERS, 1995. Momentum investment strategies, portfolio performance, and herding: A study of mutual fund behavior. American Economic Review. Cited by 255
  3. HONG, H. and J.C. STEIN, 1999. A unified theory of underreaction, momentum trading and overreaction in asset markets. The Journal of Finance. Cited by 363
  4. ROUWENHORST, K.G., 1998. International Momentum Strategies. The Journal of Finance. Cited by 216
  5. JEGADEESH, N., S. TITMAN and M.P. PAGE, 2001. Profitability of Momentum Strategies: An Evaluation of Alternative Explanations. The Journal of Finance. Cited by 193
  6. HONG, H., et al., 2000. Bad news travels slowly: size, analyst coverage, and the profitability of momentum strategies. The Journal of Finance. Cited by 214
  7. LEE, C.M.C. and B. SWAMINATHAN, 2000. Price momentum and trading volume. The Journal of Finance.Cited by 162
  8. MOSKOWITZ, T.J. and M. GRINBLATT, 1999. Do Industries Explain Momentum?. The Journal of Finance.Cited by 163
  9. GRUNDY, B.D. and J.S. MARTIN, 2001. Understanding the nature of the risks and the source of the rewards to momentum investing. Review of Financial Studies. Cited by 126
  10. LIEW, J. and M. VASSALOU, 2000. Can book-to-market, size and momentum be risk factors that predict economic growth. Journal of Financial Economics. Cited by 122
In simple terms what we know from these various studies is that:
  1. Stocks exhibiting 3-6-12 month momentum are likely to outperform in subsequent 3-6-12 month period.
  2. 1 month momentum tends to lead to reversal.
  3. Longer term momentum of 2-3 years also tend to lead to reversal.
  4. Momentum effect is more pronounced for small capitalization stocks.
  5. Studies also show sector momentum works in similar manner to stock momentum.
Besides the academic world actual market practitioners have also studied momentum based strategies and found that momentum based strategies work. In next part we will look at some of these researches

Valuation does not guarantee price, which is what we are trying to forecast. More often, valuation is a measure of risk level. Price, as many of us , learned in Economics 101, is determined by the laws of supply and demand which are in turn bounded by the human emotion of fear and greed! What's unique about price momentum based ranking system that no other variable claim, is that price cannot diverge from itself. Valuation, earnings estimates, economic fundamentals all have potential to move in the opposite direction of price, but price cannot diverge from itself. As a result, price momentum based ranking systems will lock on to the correct side of the trends. They also tend to get us out after a modest drawdown, thereby allowing profits to run while losses are cut short.
Being Right Or Making Money by Ned Davis Research (Retails on Amazon for $799 for the hardcover and $249 for the softcover).
Ned Davis is one of the most respected analyst on the street commanding huge following amongst institutional clients. Many years ago his firm published the above book and it was updated in 2000, just prior to 2000 market top. There is a reason the book is so much in demand. It details the methodology used by the firm to do top down analysis. It details various macro economics, sentiment, technical, financial, and inter market indicators used by his firm to arrive at timing model. If you want to become real "Big Picture" macro analyst, this book is a must read.
Now more important than the excellent macro indicators and their interpretation is their equity selection model. "Price Momentum Based Equity Selection (The General Theory of Relativity)", that is the title of the chapter which details the equity selection method.
The equity selection method uses one year relative strength. It uses a one year ROC to rank stocks. Then buys the top ranked 5% stock with strongest momentum and holds them until they fall below the top 10% in momentum rank.

The Quest for the Most Reliable Indicator in the World By Marke Boucher - The Hedge Fund Edge
"In the mid- to late-1980s, I was involved in a large research project with Stanford Ph.D., Tom Johnson and his graduate students. Our objective was very similar to what every trader is obsessed with today: We wanted to determine which tools actually made money in stocks, bonds, currencies and futures.I am pleased to report that we found what we were searching for.
We measured the performance of all indicators that had results we could easily measure. These included: PEs, P/Ss, volume accumulation, volatility, trend-following tools, earnings models, earnings growth and momentum, growth rates of earnings, projected earnings growth, value compared to earnings growth, chart patterns, pace of fund accumulation of the stock, capitalization—you name it.
Of all the independent variables we tested, Relative Strength (RS) was the most consistent, reliable and robust. It single-handedly improved profit better than anything else we tested.
The bottom line is this: If you’re looking for the most rigorous tool to help you pick the top-performing stocks. . .
. . .Relative Strength is it."

The real key is to make momentum work for you. Between the research and actually making it work is the process gap. You have to make it work in day to day trading. On the members site I have demonstrated various ways to trade momentum using Telechart scans and in the past few years shown in real time how momentum can be traded to beat the market.
Momentum is a structural edge and if you devote time and effort to understand the nuances involved in trading momentum, then you can gun for explosive returns. 


Related post:


Making momentum work


Are you serious about your trading?

If you are serious about your trading and want to build an enduring edge the Stockbee Member site might help you. Members tell me they have tried lot of things before coming to my site and it has offered them the most extensive and detailed methods to swing and position trade.

It is only for those who want to develop their own self sufficient trading method. It is not a stock picking service. It is service for you to build your own scans and trading method to have your own daily pick based on your method.

Be warned it will take you time to learn to trade. Learning to trade is difficult art and unless you are willing to spend months or years to perfect your strategy and also develop your mental edge you are unlikely to succeed in this game. Unless you understand that no site, no service, and no mentoring is going to work.

Why traders come to stockbee?

The member site is one of the most recommended site for learning to trade by other traders and bloggers. You will see no advertising, no hard marketing, no promotions, no free offers, no affiliate marketing, no incentive to other bloggers to promote the site, no constant twits self promoting the site, no free trial  and no tall claims of making you instantly wealthy, and yet the site attracts new  members everyday. Members come from all walks of life and all kinds of trading size and trading styles.

You will see that many trading bloggers have been using my market timing methods, scans , stock ranking lists and chart templates. They have developed their own methods based on my methods. Many paid newsletter site recommend my site to their subscriber for learning about trading and market.

Over the years thousands of traders have been members and those who benefited from the learning talk about the site to others or talk about the methods used and that is how new members learn about the site.


What will I learn in the members site?

The members site will give you in depth understanding to develop your own trading method. The emphasis is on making you self sufficient and confident of your own trading method and style.

As a member you will learn the basics of swing trading, momentum investing, growth investing and risk management.

You will learn about Stockbee Trend Intensity Breakouts method that uses momentum based swing trading to find 3 to 5 day swing trades for 8 to 40% profit.

You will learn about Stockbee Episodic Pivots Breakout method which uses Post Earnings Announcement Drift (PEAD) to find stocks that had a game changing earnings and that are likely to rally for 3 months to 12 months.

You will learn about  Stockbee Dollar Breakout method that uses momentum, range expansion and swing trading approach to find 5 to 40 dollar moves in high priced stocks.

You will learn about  Stockbee Lemonade Strategy for 401k which uses market timing and momentum to invest in 401k. You will get weekly update on how I am using the strategy on our 401k to do allocation decision.

You will learn about Stockbee Market Monitor method for market timing using breadth. It allows you to avoid risky periods in market and allows you to identify market turns. It is used for 401k allocation decisions.

You will learn about Stockbee Double Trouble method to find stock with confirmed upside momentum using anchored momentum and that are likely to continue their up move.

You will learn about Stockbee Night Time is Right Time method to find news catalyst based trade ideas for short term day trade and swing trade.

You will learn about Investor's Business Daily’s IBD 200 list and how it can be used to find swing trading candidates for explosive moves.

You will learn about Telechart 2000 and how to use it effectively to scan for swing and position trade ideas and to set up your 401k strategy.

You will learn about Jesse Livermore Range Breakout, Darvas Box setup, and many other member shared methods.

You will learn how to set up your own scans, select right kind of stocks, how to set up stops, when to enter , when to exit, how much to risk, how to track your trades and all other details about trading. You will learn about developing your own methods and not relying on others for trade ideas.

The site has hundreds of videos and trading methods and variation of methods. Members help each other in developing the methods and share actively their research and finding. A collaborative spirit allows you to get input from others on your trading ideas or problems.

The site gives you opportunity to interact with some of the most successful traders and learn from them about their trading methods. It is a vibrant community with members from different background and experience willing to help each other. The emphasis is on continuous learning and up gradation of market knowledge and setup knowledge. The members range from hedge fund employees, financial advisers, active swing traders, investors and new traders.

If you are looking to develop your own trading strategy the membership site might be for you. You have to be willing to put in the effort to build your own method. There are no silver bullets offered on members site. Every method, every scan, every nuance is detailed and all possible help is offered to design your own method.

Do you have a trial?

If you are just looking for trial you are better off trying thousands of other trading sites that offer free trial or one month trial and offer you promise of riches.

It is for those who are ready beyond the trial phase and ready to put serious months or years  of efforts to learn to trade on their own. It is for those who want to learn to find their own fish.

The free blog has all the details about the methods I trade and if you go through the posts highlighted in the sidebar you will learn about them.


How can I become a member?

To sign up go to www.stockbee.biz and follow the sign up process. The site uses Paypal for payment processing.