9/29/2014

Is it the beginning or end of selling


If you look at T2108 we are reaching levels around 20 which have been levels from which rallies have started in last few years.

If you look at MM, this is just the beginning phase of sell off with significant and growing divergence.


If you look at QE indicator, every time QE ended it has lead to 10% plus correction. QE3 ends next month.

Bottomline treacherous conditions for momentum burst kind swing trading.

Wait for conditions to improve before committing big money.

9/26/2014

Members feedback

I am so glad to have discovered you and the fantastic mentorship you provide.

Understanding momentum to find explosive stocks Part 2

In the first part of this post I explained what is momentum and how to scan for momentum. The post focused on relative momentum. There is another kind of momentum, absolute momentum which is also widely used by traders to find explosive moves. 

What is absolute momentum. Even those who claim they do not use momentum in their trading use absolute momentum unknowingly. Absolute momentum is when you find momentum for a particular stock.

Let us say we are talking about momentum on 6 month timeframe

6 month = 126 trading days

Using Telechart we can find momentum in various ways

c/c126 (relative)

now if we decide we only want to trade stock up say 30% plus in last six month

c/c126>=1.3 

it will give us stock with absolute momentum of 30% plus in 6 month.

c/avgc126

will give you six month momentum compared to average price of 126 days

if we decide to convert this in absolute momentum we can say

c>avgc126
All those who insist on stocks to be above say 200, 100, 50, 20 or any other Moving average are basically using absolute momentum

If you say I trade stocks that are within 15% of 52 week high it is also an example of using absolute momentum

Once you understand the two types of momentum, relative and absolute, you can use them to find stocks or develop stock trading scans or setups

Every Friday IBD publishes list of stocks in its weekend edition . it is an example of combining relative and absolute momentum.

Stocks have EPS rating 85 plus

Stocks have RS rating 85 plus (relative momentum)

Stocks are within 15% of 52 week high (absolute momentum)

Most of IBD methodology combines relative and absolute momentum

Nicolas Darvas method was based on absolute momentum. He used to go through stock table to look for stock whose current price was double its 52 week low. His logic was they are proven horses. Once he had list of stocks that doubled from 52 week low he would further reduce the universe of stocks that doubled by looking at stocks that have made all time high.
both are absolute momentum criteria

Doubled from 52 week low (absolute momentum)

At all time high (absolute momentum)

Richard Love in Superfperformance Stock says :

look for stocks that have doubled from 52 week low (absolute momentum)

and that are within 25% of that 100% move . In other word stock should not correct more than 25% from high (absolute momentum)

These are just few examples of using absolute momentum or relative momentum. You can use them very creatively to find right kind of stocks and pinpointed buy or sell points if you further explore this topic. If you study many methods I have highlighted, they use a combination on relative and absolute momentum to find stocks to trade.

If you are motivated trader serious about making lot of money trading go in to depth of this momentum concept and you will find many profitable trading methods. 

9/24/2014

Understanding momentum to find explosive stocks

Understanding Momentum helps you find explosive stocks and exploit them as swing trader or position trader. As a trader you want to be in stocks that for a given holding period are the fastest moving stocks.

At simples level momentum is rate of change (ROC) with which stock is going up or down. It measures speed of a move. Knowing ROC of stocks allows us to rank them and focus on those with top speed.

Let us say if you want to focus on say only 50 strongest stocks in the market. You can find them if you understand momentum. If you want to narrow your focus and only focus on best stocks in the market , focusing on 200 stocks with most momentum is sufficient to find big moves both for swing and position traders.

Momentum is time specific. In order to find stocks with momentum you must first decide your time frame. A time frame of 3 to 6 month is good for finding momentum stocks.


This stock VIMC currently ranked top by 6 month momentum.It is still holding its momentum gain. Momentum looks for stocks like these. As a trader you  want to find them right at start of momentum move. As swing trader you want to trade swings in them.

A stock can have positive momentum on longer time frame say 6 month but same stock can have negative momentum on month time frame. DGLY is current example of that.


This stock had momentum month ago. Now it has negative momentum on monthly time frame. It is down 45% from it momentum high

How can you scan for momentum?

There are many ways to rank stocks by momentum and every method has some advantages and disadvantages. Once you understand momentum you can use it creatively to find many kinds of stocks

Let us say we are talking about momentum on 6 month time frame to rank stocks

6 month = 126 trading days

Using Telechart we can find momentum in various ways

c/c126

will give you six month momentum compared to price 126 days ago

c/avgc126

will give you six month momentum compared to average price of 126 days

c/minl126

will give you six month anchored momentum compared to lowest price in 126 days

(c/c63+c63/c126)/2

will give you six month momentum calculated as equal weighted 2 period for 3 months

There are many many ways to slice and dice momentum. But all the above momentum scans are used to rank stocks . They help you find relative momentum for a universe of stock.

Most well known and popular  trading methods are based on momentum. A deep understanding of momentum can help you in your trading if you want to be profitable trader. 

9/23/2014

Members Feedback


I've been on the site for several months now and your site has been the ONE biggest

MOST POSITIVE influence in all my attempts and searches to improve my trading. 

Its a great site full of great, inspirational people who every day demonstrate their generosity ....

thank you Pradeep!

Develop basic understanding of momentum


Many beginner traders email me asking where should they start. I always tell them to try and develop understanding of what is momentum , how it works and how to use it.

Momentum is a very powerful friend of short term as well as long term traders. If you understand momentum you will be trading fast moves in the market. For investors also stocks with momentum offer various position trading opportunities

If you are serious about your trading develop basic idea about:

What is momentum.

How can you scan for momentum

What is relative momentum

What is absolute momentum

How can you use momentum

How can you use momentum in  swing trading

How can you use momentum in  position trading

How can you use momentum as a growth investor.
How can you use momentum as a value investor.

How can you use momentum as a ETF investor.

There are many ways to slice and dice momentum. Having working knowledge about momentum will help you 

No aggressive selling so far


A mild selling pressure is hitting the market so far.

In lst 14 trading sessions there have been 8 negative breadth days. but none really big 300 plus on 4% . which indicates mild selling pressure. A series of 300 plus days on number of stocks up $4 plus can accelerate selling . Absent that this looks like buyers strike. Not many buyers willing to chase at this level.

A mild selling like this can possible indicate a mild pullback. As we have seen since beginning of QE3 , there are not major corrections in the market. Most pullbacks have been less than 5% and lasting less than a month.

On a practical swing trading level, the last ten to fifteen days have had very selective rallies in handful of  stocks. But at the same time number of breakouts have failed. Few shorts are working .

As  the market has shown tendency o bounce back from minor correction traders have been conditioned to dismiss any breadth divergence or pullbacks. Which creates condition for some of the traders getting caught on wrong side at some stage. Personally I still like to be cautious at some juncture still things are clear. My objective always remain to make money but not lose money and especially not lose money due to returns so far. Low drawdowns is my primary concern.

What happens next will depend on breadth trends. If breadth keeps deteriorating then it will indicate further weakness.

9/22/2014

Understanding market breadth can help you lower drawdowns


Stock markets are composite markets.

The overall move in market is an aggregate of moves of several hundred or several thousand stocks. So the level of participation in a move is important. How many stocks are participating up or down move tells you about extent of money flow in the market. Market breadth measures the number of stocks participating in a move.

Many Of the most reliable market timing models are based on Market Breadth. Understanding  Market Breadth will help you if you want to do market timing. Study every single Market Timing model most rely on market breadth. They use different kinds of market breadth measures but ultimately the core concept is market breadth.

If you can understand this you will be able to develop your own home brewed workable market timing model. For more than 100 years people have attempted to build market timing models and they have ultimately come to same conclusion, that market breadth is one of the best way to do it.

Market Breadth tells you how many stocks are participating in a move. And it is just simple common sense that if you have more stocks participating in a move to upside it is a bullish market, and if more are participating in a move on downside it is bear market and at either end (bullish or bearish) there is breadth extreme or breadth divergence.

There can be periods when divergence can last long but ultimately either more buyers come on or more selling comes in to resolve divergence.

Ultimately most breadth based models are based on same concept of exhaustion of trends. Extremely bearish breadth is considered bullish as it signals seller exhaustion. (the 90% plus day indicator is based on that). Extremely bullish breadth is considered bearish as it becomes unsustainable and leads to trend exhaustion.

In a bearish market breadth keeps going down till it reaches extremely bearish levels. At that stage no one is left to sell. Buyers step in and you get a breadth thrust to upside. Breadth can flip from negative to positive in matter of hours near bottom. Market breadth is extremely good at spotting bottoms .

Near top there can be significant time lag between extremely bullish breath and top formation. Market breadth is not very reliable for top signal. Breadth divergences are more common in uptrends.

If you want to use breadth in your trading , there are many ways to measure breadth.

% of stocks above 200 MA

% of stocks above 50 MA

% of stocks above 40 MA (Worden T2108)

% of stocks above 10 MA

% of stocks above 5 MA

% of stocks making new high

% of stocks above upper bollinger band

% of stocks in bullish mode as per P&F chart ($bpnya)

and many more methods primarily look at finding out how many stocks are participating in a move.

In Worden telechart there are number of breadth indicators.

T2 Market Indicators

T2106 T2105 T2118 T2115 T2116 T2114 T2113 T2126 T2127 T2129 T2104 T2102 T2100 T2123 T2125 T2128 T2101 T2103 T2107 T2108 T2110 T2111 T2117 T2109 T2120 T2122 T2121 T2112

you can find this under "Main"

http://stockcharts.com/freecharts/candleglance.html?[BREADTH]

http://stockcharts.com/freecharts/candleglance.html?[BREADTHSECT]

These are also breadth indicators published daily on Stockcharts site.

The Complete Guide to Market Breadth Indicators: How to Analyze and Evaluate market Direction and Strength Hardcover –by Gregory L. Morris, is the most comprehensive book on breadth but is out of print and sold for ridiculous price on Amazon

McClellan summation index is one of the oldest breadth indicator. The McClellan paper on breadth has won The market technician award some year back. It is worth reading.

Breadth statistics are valuable because they give some of the best indications about the health of the liquidity that is available to the stock market. A small amount of money can be employed to make a handful of stocks go up or down, and if they are the right stocks then even the major market indices can be moved. But to affect the breadth numbers, which measure all of the stocks on the exchange, requires major changes in the liquidity picture. The available money has to be so plentiful that it can be spread far and wide in order to make the majority of stocks close higher, and especially so in order for the market to show positive breadth for several days.
From the McClellan paper
http://www.mcoscillator.com/download/special/McClellan_MTAaward.pdf

Growing divergence


Mountain sized breadth divergence has developed while S&P and DJ 30 make new high.

Small caps are getting sold daily and they never participated much in this bounce.

Number of high flyers are showing signs of running in to selling on new high or in pullback mode.

Breakouts are failing same day or next day.

It has become extremely selective move with very narrow bunch of stock leading the action.

Prudent course for short term swing traders is to lower exposure on long side to minimum, keep tight stops, protect open profit , be extremely selective on long side and see how the divergence resolves before making aggressive bets.

9/20/2014

Always think process flow


Everytime you see someone twitting a stock idea, ignore the idea, try and find out what process this person uses to find that stock.

Every Time you visit a blog of someone you think is good trader find out what process this person uses to find that stock.

Every time you read a book on trading find out what process this person uses to find that stock.

Every time you attend a trading seminar or workshop ind out what process this person uses to find that stock.

The process understanding is very important. If we do that we should be able to find same stock and trade it in same way.

Don't get fascinated by picks ask the person

"Brother or sister can you tell me what step by step process you use to find these things. What scans did you use. where did you enter why, where did you exit or plan to exit, how much did you buy"

and if he or she can not tell you that it is difficult to make money from those ideas.

9/19/2014

Eliminate Processes and methods


There is a diner next to my house, it has menu which runs in to 10 pages with around 10 items on each page. That is like 100 items.

Think about it . 100 items require 100*5= 500 ingredients or more. Plus you need people to know 100 processes.

As against that if you see food trucks , they have 2 to 5 or in some cases just 1 item on menu.

Be like food truck and not a diner.

Trade as few methods as possible.

Just because you know 100 methods do not trade 100 methods.

Learn from them and incorporate some learning in your method. but do not start trading too many methods.

Less processes you run easier it is

Less is more when it comes to trading.

Just trade 1 to 3 methods.

Do not clutter your mind

Start with process flow if want to improve your trading


Start with process flow if want to improve your trading

However imperfect it is start first by setting up a process flow for trading any setup you like.

If you like momentum bursts setup process flow

If you like anticipation setup process flow

If you like trading news set up process flow

If you like CANSLIM setup process flow to find and buy IBd kind stocks

If you like beaten down stock setup process flow to identify and buy them

If you like EP setup process flow to trade them

If you like to buy near 52 week high setup process flow to

If you like to trade earnings setup process flow

If you like to trade stocks that go up 300% in a year setup process flow to find and buy them

If you like Lemonade strategy set up process flow to trade it

If you like to trade others picks setup a process flow to find and trade them

If you like to trade IPO setup process flow to find and trade them

If you want to trade options setup process flow to find and trade them.

If you like to trade stocks that start with A setup process flow to find them

If you like to trade stocks that start with Z setup a process flow to find them

Unless you have a process no miracle can make you good trader or investor.

Once you have process you can start to improve it

Once you have process you can do things in less time

However imperfect your process , it is the first starting point to becoming profitable trader.

In the beginning run only one or two processes. Your brain will not be able to handle many processes simultaneously. So be less ambitious .

First question you should always ask is what is the process to do this. You read a trading book , fine but unless you have a process to convert that books trading idea nothing will happen.

Stop dreaming about the money you will make trading. Unless you have a process nothing happens. Once you have process you start finding trades. Once you have a process you follow it to enter those stock. Once you have process you know when to exit them or put stop.

As you trade more a process you will find simpler ways to do same thing. Once you have one good process for swing trading going well then you can add more processes.

When developing processes think simple. Simpler a process and less the steps involved in it easier it is to perform. If your process involves 10 steps something is wrong with it.

If you see this site it is all about processes flows. And most likely first question you will encounter from Stockbee members is what is your process flow to find these stocks or options. You will see members have done process innovation around simple setups.

Learn to be process focused and money will come. the person who made 96 million trading Episodic Pivot has simple process flow. when he started to explain it , members were like there must be something more to it. But all he does day in day out is follow simple few steps process flow. Good trading is like that.

Once I found process flow I became profitable. Before that I used to go crazy working till 2AM in morning to find stocks. Now same task takes less than half an hour.

Once I became process oriented things began to happen. I found process flow to find big earnings surprises and tripled my account in few months.

Become process oriented if you want to make money trading . Start today.

And there is no other better place than the Stockbee Member site to learn to do it. everything is about process orientation here.

You will find process to find momentum burst.

You will find process to find Episodic Pivots 

You will find process to find stocks that Doubled (Double trouble) 

You will find process to find stocks that have been cut in half (Half trouble) 

You will find process to use news to find day trades (Night time is right Time) 

You will find process to use to use Investors Business Daily to find good growth stocks 

You will find process to determine entry , exit , stops, position size. 

You will find the process flow of the trader who made 96 million trading Episodic Pivots 

You will find process flow to fully automate trading 

You will find process flow to take 100k to 160k in month in the ongoing Options Quest being traded real time by @cammotrader 

You will find process flow to find big winners and play golf courtesy @ckergin 

You will find process flow shared by hundreds of members 

You will find processes to fit working people

Even if you are not a member , you will find simple processes shared on this site daily.  Read the posts highlighted in sidebar they have many of my process flows.


Methods (processes ) trump markets is the motto of this site and that is the key to success in trading and beating the market.

Become process oriented today.....

That is if you want to make serious money trading .....

9/18/2014

Stocks move in momentum bursts


Even if you eat green eggs and ham for breakfast stocks will still move in momentum bursts.

This is the most basic tendency of stocks moves.

It existed hundred year ago and it still exists in spite of chorus of market having changed.

Stocks when they move they move in burst moves.

And all such burst start with range expansion.

Stocks move in momentum bursts of 3 to 5 days

Stocks move in momentum bursts of 8 to 40%

Try studying this phenomenon and you may like it.....

Try it . try it....

Finding breakout anticipation candidate

Stocks move in sharp momentum bursts of 3 to 5 days. During that 3 to 5 day burst move they can go up 8 to 40%.

One way to trade these kinds of momentum bursts is to anticipate zones from which a likely momentum bust will occur. Or in other word look for a continuation setup.

Advantage of anticipation is you can get a very close entry on breakout . You can also create a predetermined buy order above the  consolidation area and enter.

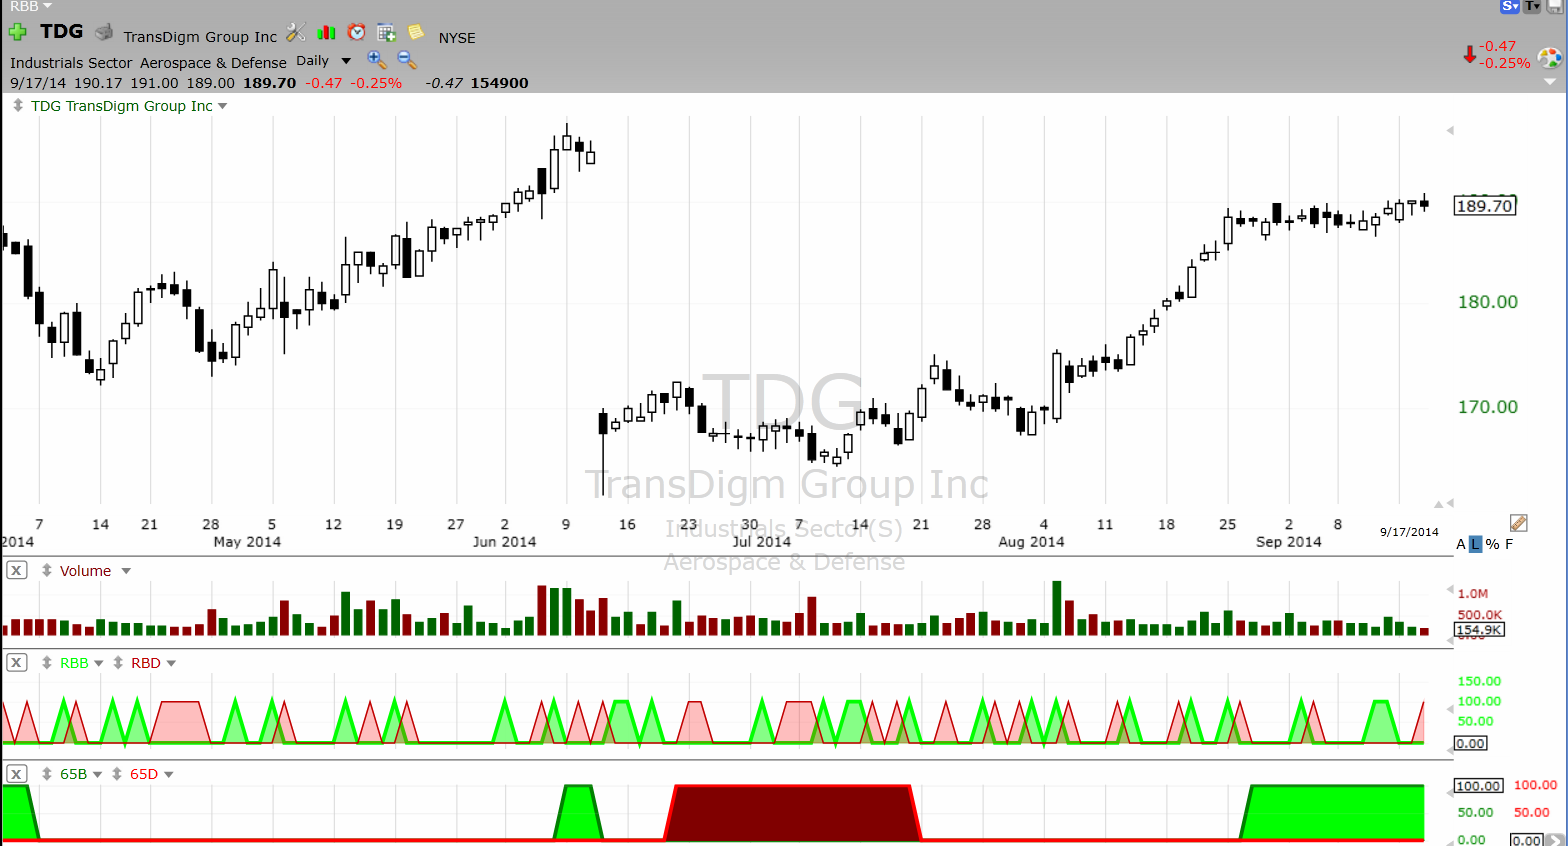
JMBA , ACM , and TDG are three example of this kind of setups.


If you study these 3 setup , they all have common character. For last 8 to 20 days these stocks are not in momentum burst phase. They are in non momentum phase on smaller time frame. The volatility during the consolidation is low as these stocks have traded in very tight range.  Yesterday they had very small move up or down of less than .5%.

Stocks often breakout or breakdown from these kind of zones with burst moves and make big 3 to 5 days moves. In a year you can find and trade hundreds of setups like these.

Anticipation Setups watchlist

XRS
MNST
RGS
DAKT
JMBA
BTX
MFRM
GCAP
HZO
UTIW
WSBF
MPAA
ACM
NWL
AMED
OVTI
ENH
CRI
ROST
PVH
BG
IMS
MELI
TDG

In order to generate above list I or Stockbee members go through around 300 stocks that have established trend. The 300 stocks are scanned for up or down move of less than 1%. That is the starting point for finding good anticipation candidates. From that 300 stocks list final 5 to 20 candidates are selected using guidelines I have developed for this setup.

Once the list is ready you can further narrow it down with other criteria like earnings, Zacks rank, valuation, sector , age of trend , float , price , capitalisation, short interest and so on. It might give you a small universe to focus on. But stocks need not have any reason for these kind of moves so just looking at quality of setup is enough.

Once the list is ready I start putting alerts on these stocks. I feed the list in my trading platform and set alert levels at which  a breakout move is likely to trigger. If the alert goes of then I buy the stock if capital is available.

In order to daily find stocks like these you need to setup everything. It takes me and members around 15 minutes daily to do this. once you get a hang of it you can scroll through charts rapidly and find the good setup very fast.

If you are really serious about making money trading you can do this yourself. If you are really serious about making money trading you can study hundreds of past moves to find what to look for in good anticipation setup. If you are really serious about making money you will figure out how to scan for these kind of stocks. If you are really serious about making money trading you will find many variations of this setup.

9/17/2014

Where should you put a stop

Stops are setup specific .

There is no one universal stop strategy that works. Stop s just one element of your trading system. Unless all elements of trading system are in sync random stop strategy like put stop at 8% or 10% below your entry is not going to work. Plus it is a dangerous advice to give someone if you do not know the setup.

If you are going to be swing trading say momentum bursts , your stop strategy should be in line with that setup idea and should be as close to start of momentum burst. If your setup is trend following your stop should also be at level where trend failure will be. 

If you are going to hold position for long term your stop strategy should reflect that. I have a long term position in XIV which is up 78% from entry and it has no stop. For position trading like that you can control risk by sizing of your position. 

If you are trading short term mean reversion not using stops is best. Again in those situations risk is managed using position sizing. 

Stops also depend on your own personality and returns objective. Some like wild swings in their account and can manage that emotionally. They can take their account up and down multiple times. They like the drama of it. Some like returns with very little drawdown. Their stop and setup strategy reflects that. 

Unless you think through specifics of your entire trading strategy and also your personality and ability to handle risk there is no one specific stop that works. Once you are clear about what your setup and goal is there are many creative ways to use stops.

Your stops strategy is no different than managing relationship in real life. There is no one way to satisfy your boyfriend or girlfriend or husband or wife in a relationship. It depends on kind of girlfriend /boyfriend/wife you have and also kind of  situation and it also depends on your own personality. Some like volatile relations , some like smooth drama free relationship. And also it depends on whether it is one night stand or long term relationship.

Same thing works for stocks.

Methods and philosophy

Advice from veteran trader about developing trading plan


One of the new trader asked how to develop a trading plan. One of the veteran trader who has made millions trading and is Stockbee member gave him the following advice:


I do not have a link or resource that I can point you towards to develop a trading plan, but here are a few thoughts.

If you are struggling (losing money) and trading without a plan (throwing darts). STOP! Doing the same thing and expecting different results is ridiculous

Eliminate the noise.

Take this site and only read Pradeep's post. Take his teachings, study them and from them begin to develop your own plan. Paper trade it or buy 10-share positions to develop confidence. Learn and adjust.

Work harder.

Honestly assess your commitment to the process of becoming a successful trader. Most of what happens during the trading hours is the execution and the realization of the work you have put into reviewing hundreds of charts before and after market hours, looking for that one or two gems where you can commit your capital

Do the exercises

Pradeep has outlined and/or suggested. Trading really is hard work, but can be VERY rewarding once mastered

Make a commitment to never taking anyone else's trade.

In the years I have been here never once have I taken a trade from Pradeep or another member. If a symbol is posted and you want to evaluate it according to your own analysis, do so. Unless you are day trading, successful trading rarely requires a snap decision without thoughtful analysis

Learn to use alerts.

A simple trading plan is to buy a stock as it crosses up through its 50-day moving average. Go through your entire universe of stocks that you want to trade and set up an alert where you would like to enter. This will help you get better entries.

Draw trend lines on your stock charts.

Up trending stocks tend to move in zig-zag patterns creating a channel. If you get an alert when a stock hits the bottom of your channel, buy it and set your stop to close the position if it closes outside the bottom of the channel. Take profits when it gets back to the top of the channel.

Go into this adventure of trading knowing that it is you, and only you who will ultimately determine if you are going to be successful or not.

Make the commitment, avoid others opinion, quickly get out of positions when they go against you, trade small to build confidence and keep a journal documenting your trades, your thoughts about the current markets, why some trades worked and others didn't.

From all this your trading plan will "magically" appear over time.


Methods and philosophy

9/16/2014

How to use after hours news to find trading opportunities


Short term moves and also many long term moves are precipitated by some news event.

If you everyday systematically identify 3 to 5 opportunities from the news released after hours you will find good day trading opportunities.

Some of the news is not just for one day it can have multi month effect. So you can use for position trades also.

For example RAX after close released news about management change and it's intention to remain standalone business. As a result it is down big after hours.

Tomorrow most day traders will be actively trading this stock on both long and short side.

The same news has potential to lead to further down move in next few months. So position traders would also be looking at it.


X is another stock with big news after hours and was up on news. Related sector stocks will also be in play tomorrow.


Like this in process term if you study news daily after hours and pre market you will find good trading candidates.

This is a skill which one can build over time if you want to trade these kind of stocks.

All the information needed to do this is freely available. All it needs is a bit of elbow grease. 

Earnings After the close today

http://goo.gl/1BMpcp

Earnings Tomorrow before open

http://goo.gl/112kJH

After hours movers

http://goo.gl/G3h2il

Earnings Surprises

http://goo.gl/RTuzX7

Breadth has deteriorated


Slow selling in last 9 days has resulted in steady deterioration in breadth. however selling is slow motion selling so little bit of big buying can lead to bounce.

Same thing you can see on $bpnya


Number of recent breakouts have failed immediately. The large cap indexes holding relatively well.

Against the backdrop tactical adjustment in trading swings is required. Lighter commitment till range resolves is my plan. 

9/15/2014

How to make money in your 401k


If your 401k has not gone anywhere over last 10 or 15 years then you should look closely at your approach to investing.

Lot of approaches used for investing in 401k suffer from negative compounding as they remain fully invested during market downturns.

If you are motivated to avoid that kind of negative compounding effect then you should look at buying mutual funds on extreme breadth weakness and sell on extreme breadth strength.

Buying when there is extreme breadth weakness on Index , ETF or mutual funds (which are composite of number of stocks) works but it may not work on individual stock. Individual stock might go out of business but composite have rotating roster of stocks.

The mutual funds recover from weakness as they replace laggard stocks with new stocks. The best money can be made i n 401k if you buy when breadth measures are at extremes. Those are the zones from which markets and mutual funds start moving up . As a result you benefit from very good entry.
If you remain in market through correction even though your funds will bounce back due to compounding effect you would still be down and missing on new gains.

Best time to buy is when market corrects 8% plus and then market breadth becomes extremely negative. 

To do this you need to develop skills . This is not for everyone. You have to understand market breadth and need to develop a setup to identify extreme weakness and strength. Ordinary investors do not have aptitude and skills to do that . But if you are motivated you can do this and get much much better results. 

the Stockbee Lemonade Strategy uses that kind of approach. Stockbee 401K Lemonade Strategy main points are:

Become bullish once market has 8% plus correction from high and reaches extreme bearish zone on Market Monitor or other breadth measures like T2108 or $BPNYA

Rallies that start from such extreme oversold levels are signaled by series big breadth days of 500 plus on Market Monitor.

This intense buying in short time period leads to a Breadth flip. Breadth flip is signaled by breadth ratio of 5 and 10 days flipping from negative to positive in very short time period. 

Breadth flip results in Market Monitor Primary indicator turns positive after being negative and reaching extreme negative breadth.

Time to get fully invested at this stage in 401k.

The fund to get invested is selected based on Trend Intensity of  42  days (TI42) or historical beta of funds . Highest ranked funds are selected. During the length of the bull move the objective is to be in Top 3 ranked funds by TI42

Ideally it is best to be invested in just 1 top ranked fund.

Remain in fund as long as it continues to be in Top 3

At some stage the MM Primary indicator or T2108 or $BPNYA  bullish breadth readings will reach extreme. Look at exit at this stage or protect open profit aggressively.

Objective is to as far as avoid down periods and get invested near bull market bottom.

Compounding works very well if you do not have negative returns period.

Methods and philosophy

9/12/2014

The sweet spot for swing traders


As a young stockbroker trying to figure out the market in the 1950s to early 1960s, Bill O'Neil made an important observation.
He noticed that stocks tend to rise from a proper base, advance 20% to 25%, then correct, often forming a new base. So O'Neil came up with an important component of his plan for stock market success: Sell most of your stocks once they rise 20% to 25%.
O'Neil, founder and chairman of IBD, also noticed that if a stock made a big advance right out of the gate, it had the best chance of being a big winner. So he came up with another rule. If a stock advances at least 20% in the first two or three weeks after breaking out of a base, hold it at least eight weeks, then decide whether to hold it for the long term, hoping for a big gain. 
Smart Investors Lock In Profits At 20% To 25%

This is the crux of IBD methodology . It is a swing trading method to find 20 % kind of moves on momentum stocks. Occasionally it finds big movers.

In reality many of those 20% kind of movers do not make the 20% move even if you bought them at proper IBD buy points. You would end up with 8 to 12% moves.

It is not IBD that is focusing on 20% kind moves. Bulk of the active traders effort are focused on finding that kind of moves , because most traders who have studied the market found same thing.

That is the sweet spot in stock moves.

If you accept that then life becomes easy. You do not spend lot of time dreaming about finding big winners. They are there but they are rare. Focusing on 20% move is relatively easy game.

The next question is if the objective is to find 20% move , then are there other ways to do it. After all what Bill O'Neil is not gospel truth, unless you are mindless rabid fan of it.

Think how you can find 20% moves in different easier ways...

Methods and philosophy

9/11/2014

Breakout anticipation buy watchlist for September 12 , 2014

For anticipation I look for stocks with minor pullback or sideways consolidation and that are up  or down less than 1%.

This list offers opportunity to enter some breakout in anticipation and some as soon as they start to breakout in the morning.


CMG
BIDU
TDG
MHK
SCTY
OVTI
INTC
ZEN
TSRA
PTRY
WLK
LEA
RLGY
DTSI
LPSN
EBIX
HTLD
ENH
RJF
PLNR
IRDM
ACCO
BLT
CERN
SVU
HA
LGF
JBLU
ILMN
MDSO
MWE
TSLA
YELP
PVH

You can do this yourself using the step by step instructions in my post "How I generate my breakout anticipation watchlist"

If you are just starting out trading


If you study the Market Wizards or other many very successful traders who are not featured in market Wizard , most took around 10 years to put together a complete method. Many blew up couple of times before that.

What happened during that period is they had many beliefs and assumptions that got shattered or changed.

If you are just starting out trading your objective should be to reduce that timeframe from ten years to few months. It took me around 2 years to be profitable. Those 2 years were intense 18 hours a day effort to learn about markets and test thousands of things.

Most important thing is not to blow up during learning stage. The Market Wizards and others might have done that , but you don't need to repeat that mistake. I  never lost original capital during learning phase. In fact multiplied the original capital many many fold in last 14 years.

Reject lot of hypothesis , you will hear lot of things about market or stocks, don't take those things at face value. Your ability to reject ideas is important.

Find out what actually real traders use. This is the most important thing. Find out what tools they use. What setup they use. What kind of process they use to find and manage trades. The earlier you do it higher will be your probability of being successful.

Find how traders really make money. Do they make it on one or two big trades in a year. Do they make it by catching hundreds of moves. Do they make it by risking large amount to catch small move. Often highlighted trades can be deceptive. If I say my trade made 15% , it mans nothing unless you know what was the size of the trade and how much was it as % of capital. Get hold of actual trades of real traders with entry exit and more importantly position size to understand how they really make money as against what you believe they make money. That might be eye opener for you.

Talk in person to real trader . You will learn more that way. Person to person interaction will tell you more as you can get things clarified. Never give up an opportunity to meet face to face with good traders. One hour spent with them will help you learn more than reading hundreds of books.

Innovate around indicators and patterns. Obvious things do not work. I see lot of new traders trying to trade things like MA or MACD and then they are frustrated. Learn to use them in innovative ways and you can make them work. Most edges are built by innovating around indicators or patterns , obvious and popular things  do not work as good as you think they should. Most successful traders will tell you that.

Don't spend crazy amount during the learning period. Use free resources and internet.


Does earnings matter if you are trading momentum burst

We have many beliefs and assumptions about how stocks move and markets operate. In order to successfully trade a specific setup you must have right beliefs and assumptions about that setup and that time frame.

A  momentum burst is a short term swing trading setup that looks for 8 to 40% move in 3 to 5 days. Now in order to trade this kind of setup you must thoroughly look at all your assumptions. A deeper understanding creates conviction in setup.

Yesterday I asked a question Does relative strength matter if trading momentum bursts Your Answer to it will determine how you trade that setup. You might start with certain assumptions and then change them over period if you see different results.

Not everyone can change assumptions and beliefs. Some people are fixated on certain beliefs and their behavior is driven by it. Also certain kind of environment is ideal to changing assumptions and beliefs. This tends to happen in group situations where blind beliefs do not get accepted and get challenged.

The question for today is simple: Does earnings matter if you are trading momentum burst

The answer we can find ourselves by going through stocks up 8% plus in last 5 days. To do that in Telechart you can run two scans.

Bullish 8% plus or 5 dollar plus in 5 days

c/c5>=1.08 or c-c5>5 and minv3.1>100000 and c>=5

Bearish 8% plus or 5 dollars plus in 5 days
c/c5<.92 or c5-c>5 and minv3.1>100000 and c>=5

That is just one day of data , if you are really serious then you can study this for years worth of data. From the study you will be able to answer the question: Does earnings matter if you are trading momentum burst


9/10/2014

Stockbee Members feedback

Members feedback that made my day

"Part of my problem is that there is just too much good info on this site everyday."

"What has been great about this site is that there are a lot of great traders with different styles. I admit I've stolen a lot of ideas. Some contemplate into what I had been doing really well. Other style's I just marvel at --MHP's mechanical system for example. That is beyond my capabilities but wow is that cool. Some were completely new to me for example the "EP" trade, which I've now become obsessed with."


NEO: A momentum burst setup example

NEO today is an example of momentum burst kind of setups I look for.  The stock had orderly pullback/consolidation after the first leg of rally. The stock had 2 less than 1% narrow range days prior to breakout. Had Trend Intensity above 1.05. this is the kind of setup that will show up in my anticipation scans.


Sometimes these kind of setup fail. As it happened in TEDU and CMCM recently. But that is part of the game. 57% of breakout setups are currently working for me with 2.03:1 risk reward ratio. So occasional failure does not affect me.

Doing homework to find these ahead of breakout using anticipation scans can help you get in to them early as they start to breakout. Anticipation has been my focus area for many months now and everyday I try and identify 10 to 20 good anticipation candidates.

To find setups like these before breakout scan for stocks up or down less than 1% and that have established trend.  These trend pauses offer good risk reward setup under good market conditions. 

Does relative strength matter if trading momentum bursts


We learn by revising and revisiting our assumptions and beliefs. This is a continuous process. As we get exposed to new information we revise our current thinking. This process starts from birth and continues in most adults till they die unless they join some cult.

We must ask certain questions in the context of swing trading. In swing trading I am interested in a 5 day move of 8 to 40% or 5 dollar plus in a stock. Those are the only stocks of interest to me for swing trades. 

With that contest one must ask certain questions about stock behaviour. To begin with let us ask just one question.

Does relative strength matter if trading momentum bursts?

The answer we can find ourselves by going through stocks up 8% plus in last 5 days. To do that in Telechart you can run two scans. 

Bullish 8% plus or 5 dollar plus in 5 days

c/c5>=1.08 or c-c5>5 and minv3.1>100000 and c>=5

Bearish 8% plus or 5 dollars plus in 5 days

c/c5<.92 or c5-c>5 and minv3.1>100000 and c>=5

That is just one day of data , if you are really serious then you can study this for years worth of data. From the study you will be able to answer the question: Does relative strength matter if trading momentum bursts?

And the answer is .....

9/09/2014

How to find good buy points


TEDU is an example of a kind of setup that makes me money trade after trade. TEDU had a breakout yesterday morning and bought. Stock is already up from buy point.

Before the breakout day it was in anticipation scan I run. The anticipation scan looks for stock with narrow range days that are likely to breakout in day or two. 

This is how TEFU looked before breakout day:


As you can see it was down .56% or 8 cents before breakout day. If you have identified such setup pre breakout through your daily scans and homework, you are ready for it next day as soon as it starts making even a 1% move you know this is likely to go up.
Anticipation of breakout allows you to narrow down your list of candidates to just a handful good quality setup and then you enter either before the breakout or as soon as breakout happens. the threshold for breakout on these kind of stocks is lower as you know it is having range contraction prior to breakout. This gives you a very close stop in case tarde does not work.

If you want to be a swing trader study thousands of such past setups. The essential element in success of these kind of setup is  range expansion at the beginning of a swing. That is the essence of swing trading. Swing trading tries to capture part of a trend move or a range move. If you buy at beginning of swing you can sell near end of swing.

Look for stocks that are currently not having range expansion and are consolidating with narrow range days.  Orderly consolidations are low volatility periods where buyer and seller at equilibrium. A range expansion from that phase indicates fresh buying pressure. That is noticed by swing traders and momentum traders and they then further extend the move as they buy the setup.

To find such buy points you need to do your homework and identify 10 to 12 good pre breakout setup and then watch them next day and pre decide where you will buy. Alternatively you can develop a automated program to buy them on breakout.

If you are a motivated and serious about making money trading , you can set up this entire process in few days and find daily buy or sell candidate. It is not very difficult process once you understand how to do it and put in around 20 minutes of homework.

9/08/2014

Barron's cover bullish


As a contrarian you should be worried when bullishness makes the cover.

But on practical level i just trade a setup. If a stock mets setup criteria I buy , as I did today with 3 stocks. If setup criteria says short , you short. It is all about small edge exploited hundreds of time.


9/06/2014

What should a well defined setup tell you


You have a choice of setups to trade. Setup is complete set of conditions involved in trading a particular method.

A well defined setup will tell you :

  • what kind of stock or etf or instrument  to buy
  • why
  • where to buy it
  • how much to buy
  • where to put stops
  • where to exit
  • what kind of profit can you expect with this kind of setup
  • how many trades can you expect with this setup
  • what overall market conditions favor this setup 
  • When should you not trade this setup
  • when should you risk less or more
If you have a well defined setup idea you should be able to replicate another persons trade on your own. 

If you are a beginner trader what you need most is a complete setup idea and template with detailed process flow and steps. If you find that early in your trading career it will save you time . money and frustration.

As a trader you have a big choice of setup ideas. There are hundreds of setup ideas in public domain. If you exhaustively study the books written by traders or about traders, read blogs written by traders and do some research you will come across hundreds of setup ideas. 

Some of them are explained in detail and all details to trade them can be found if you dig a bit. In fact life for new trader is much easier today due to internet. Everything is available in public domain. 

It is a different issue that as a beginning or struggling trader you may not even understand the importance of setup or a complete setup. 

If you are a Stockbee blog reader you will see that my day in and day our focus is on trading specific setup. And if you are motivated enough and go through last six months of posts you will find all kinds of details to trade my kind of setups. It is all detailed here.

There are setup I currently trade. And all of those are detailed on this site and you will see several trading blogs trading similar or variation of those setups. Many trading blogger are Stockbee members or were members at some stage and now trade some of those setup ideas or have developed own setup.

There are setup ideas I have discussed here but do not actively trade. Does not mean those set up do not work but for practical reason I focus only on few setups. If you go through posts in sidebar you will see many examples of that. All of those setups work.

Besides the setups I trade I know of  lot of them because of the Stockbee members site. There are many setups discussed by members that they trade,  you will find at least 40 to 50 setup ideas traded by members discussed in detail and some share their trade real time.

there are some setup ideas that produce big winners. Episodic Pivots is one such setup idea. It finds big winners of 100% plus kind magnitude. But it trades infrequently as those kind of setups do not show up everyday. Trading a setup like EP requires you to understand that  and accordingly be very selective.

Swing trading  setup ideas  produce frequent but small profit. The Momentum Burst kind of setups I trade is one of those kind of setup. It produces hundreds of trades. Advantage of setups like that is it allows you to profit with very little drawdown.

Setup ideas should not be a problem for you if you are a beginning trader or struggling trader. What you might find difficult to find is detailed step by step process flow to make them work. But that problem is also not a serious problem if you are motivated trader.

The problem is not lack of setup ideas. The problem is lack of skills and fluency and confidence in trading them . Setup ideas work when you spend sufficient time  developing skills to trade those setups and becoming proficient at them.

If you are a new or struggling trader hunt for detailed setup ideas and templates.

Methods and philosophy