3/27/2014

Recent corrections and bottoms

Market is in correction mode. It has not yet corrected much but if the selling continues then we might have bigger down move.

How does market recovers from such corrections:

spy2.png

The above chart shows 2010 correction and subsequent recovery. It took some months for market to put in bottom.

The two charts below show bottoms in 2011 and 2012. 2012 correction was shallow correction.
spy.pngspy3.png


No matter how the market action develops all that matters is setups. If setup sow good buy or sell candidate , you buy or sell. 

3/26/2014

Hunt for next pocket of momentum

Market had a weak bounce attempt. The old world stocks like JNJ, IBM, CAT, CSCO and other defensive sectors like REIT dominated the action. For a sustained bounce you want to see much better action.

However as momentum trader you have to hunt for new pocket of momentum. So far the alternative energy sector seems to be attracting momentum trader. The sector got some lifts from ARTX, BLDP, and PLUG.

Momentum traders tend to quickly migrate to new set of hot sectors when momentum dries up in one sector. 

If there is going to be lasting bounce some of the beaten down stocks will also bounce back, but focusing on genuine momentum pocket is always better.

And one of the best way to find momentum pockets is by keeping close watch on these lists. 

3/25/2014

Momentum leaders correct

Momentum does not last forever and at some stage all momentum leaders tumble or correct. We are witnessing that currently.

Often momentum leaders correct as a group and during that period no leader can be safe. If you are not careful during such period, you can quickly lose bunch of money.

As you gain experience trading momentum leaders over years, you become good at avoiding such periods and unlikely to get caught in such drops. That is the key to thriving and surviving as momentum trader.

Breadth based indicator often warn you of possible risky zone. Extremely positive breadth precedes such turning point. In current correction that was the case.

Besides that other indicators like follow through on momentum stock breakouts and blowout moves also helps you warn of possible risk.

Having traded momentum for 14 years with no down year, I have learned to pay attention to such nuances. The objective in trading is to avoid risky periods and not get in to significant hole.

Trading momentum style is not for everyone. Some can not bring themselves to quickly close open positions and go on sidelines when trouble shows up. Some are wedded to their stops and don't close till stop is hit. In the kind of action you saw in last couple of days  you can quickly lose open profit and also end up losing money on recent breakouts as they fail.

Now in the short run market might bounce back, but will that bounce stick, we don't know. But breadth will tell us if there is sufficient and aggressive buying during the bounce. 

3/24/2014

Distribution visible


Distribution is clearly visible on the Nasdaq Composite Index. We had 7 negative days in last 12 days.

Many of the momentum leaders are now in correction mode. Series of Chinese stocks had high volume correction after a multi month rally. The drug and biotech stocks are another set pf stocks that had big down day on Friday.

But this market has repeatedly bounced back from such setbacks for last 18 months. Will that continue, we will find out soon.


3/21/2014

Decide your approach


Either trade infrequently , in which case you will need to find big winners only. This is extremely research intensive approach and it works if you are willing to do concentrated positions. 

The downside is you will have higher drawdown if the large size position does not take off . 

More practical issue is for someone just starting out in trading it will be difficult to learn this kind of style as there are very few trades in a year. 

You will not be using your skill frequently so it will take you years to gain expertise.

Trade frequently with small targets.

That is the approach used by I think 99% of active traders. 

You make money by catching several small moves. 

It is comparatively easy to learn as you will do large number of trades and learn quickly due to sheer volume of trades.

Those are two clear choices.

You can do combination of both.


Trade infrequently

Approaches to study :

Value investing : buy stocks that are undervalued hoping market will discover them and they will get back to value

Growth investing: Buy stocks of companies growing earnings and sales faster than average stock and find these stocks right at the start of the move

Contrarian investing: Buy weakness and sell strength


Trade Frequently

Approaches to study:

Momentum breakout : buy stocks that are going up during. During that move they will frequently go sideways or retrace and you have to buy on b/o once that period ends hoping momentum will reassert

Momentum anticipation/pullbacks : buy stocks that are going up during. During that move they will frequently go sideways or retrace and you have to buy in anticipation this will end hoping momentum will reassert

Momentum contrarian/mean reversion : Sell a high momentum stock near its high hoping the move will fade or buy stock going down near its low hoping it will bounce back.

Prey on market structure : Mostly done by quant funds, day traders and market makers where they use knowledge of order flows, stops, news effect, correlations, historical tendencies and seasonal tendencies to find small profits.

Many variations of these basic approaches exists. People call these things by different names, use different scans, use automation , claim they have secret sauce , but when you strip it down to basic they do one of the above.

3/20/2014

Do what Mikaela Shiffrin does to improve your trading

Use practical psychology tools to enhance your trading. There is lot of discussion on trading psychology without practical tools you can use yourself to enhance your trading performance. One of the most powerful tool is visualization or simulated practice.

Mikaela Shiffrin Gold Medalist was asked how she practices :

http://goo.gl/SNebP5

What’s your training regimen like now? 


I still need a lot of training to work on my technique. I’m racing with girls who have 10 years mileage on me, so I have to take every chance to train. I’m on snow for five hours a day on average. That includes putting my boots on, lift rides, recovery after each runs. But I do try to take as many runs as I’m strong enough to take. Sometimes it’s 15 runs on a full-length course. A lot of my day revolves around visualization. You can pretty much simulate training if you do well enough. Your brain can’t tell between skiing and visualization. You can get double or triple the amount of training.

If you see athletes during game play or during performance, they use continuous visualization. They simulate their play in mind and in between shots mentally rehearse it.


You can use same technique in your trading. Visualise what would be your ideal trade. How would you enter. Where would you put stop. Where would you exit. Make that a habit . Do it several times in a day.

Simulated practice helps you build automaticity and helps with discipline. But for that you have to do it many times. It does not need to be elaborate exercise, but repetition is the key.

This is a practical way to improve your trading psychology everyday.

3/19/2014

If trading psychology is a issue for you


If you talk to many very successful traders they know the importance of trading psychology. But they are not consumed by it. In last 10 years I have interacted closely with many successful traders, few market wizards , and some hedge fund people, none of them had ever hired a trading psychologist. And most of those people are at top of their game. The key to their success is their belief system.

But if you talk to struggling traders they often think trading psychology is important and some claim it is the most important thing. If psychology is an issue for you and you think it is affecting your trading , what concrete steps can you take to resolve it.

There is lot of talk of trading psychology , but what exactly are the 3 or 5 things you can do to improve your psychology.

If you want to increase your muscles you go and lift weight

If you want to improve your stamina, you go and run daily

If you want to reduce weight you eat less and exercise more

What exactly do you need to do to improve your psychology.

First starting point if you want to improve your psychology is by examining your beliefs

You can only trade what you believe in.

Your beliefs drive your behavior.

If you believe only way to trade is using mechanical methods ( that is a belief) and as a result all your behavior will flow from it.

If you believe one should only trade triple etf and not waste time on individual stocks (that is a belief) and as a result all your behavior will flow from it.

If you believe that only way to trade is with big risk (that is a belief) and as a result all your behavior will flow from it.

Every trade has deeply held beliefs. The bundle of deeply held beliefs drive what kind of setup they will trade, what kind of timeframe they will trade and also all elements of trade like entry, exit , risk,  and number of positions held.

Beliefs are not necessarily based on science or logic. In trading there are many beliefs based on to others pseudoscience . Personally I would never trade based on Elliott Waves , because it is not in line with my belief system. I believe it is not scientific and hocus focus. But there are traders who build their entire trading around it.

Your beliefs drive your trading actions. If you want better results in your trading you start by examining your beliefs about market, how they operate and about your trading and beliefs behind those trading decisions. A critical study of them might show you where you need to fix things.


It is  difficult to change beliefs. Contrary to what self help books and many motivational authors and speakers will tell you it is not easy to change beliefs. Beliefs persist for lifetime in some people. So much of human behavior is driven by beliefs. Religion survives because people are driven by beliefs.

But psychologists who have studied beliefs know it is difficult to change deeply ingrained beliefs. There are no magical technique or method which will change your beliefs overnight.To change beliefs you need to educate yourself , expose yourself to new way of thinking, get rewarded for new beliefs.

When you are kid you have many simple beliefs, like monster exist or eating sweets will lead to cavities, or my parents are going to be forever, but as you grow and get exposed to science your beliefs change.

New knowledge and new discovery leads to change of beliefs. Same thing with markets and and trading. More you educate yourself and expose yourself to different beliefs you will reexamine some of your deeply held beliefs and start changing them. Your surroundings and people you interact with also helps to change or reinforce your beliefs. If you want to change beliefs change your surroundings, friends, family and incentive structure. 

For traders same thing applies. If you hang around with traders who all the time whine and "believe" market is manipulated, you will also imbibe same beliefs, you will get rewarded in that setting for those beliefs. If you change that and say start interacting with a highly motivated trader with 10 year plus track record and no negative years , your beliefs will change. In that setting you will not be rewarded for your beliefs about manipulation.

First starting point if you want to improve your psychology is by examining your beliefs

Align your beliefs with market structure by educating yourself about how markets work. Align your belief with what has shown to have worked in the market based on history and statistics. Align your belief with a style of investing growth, value, contrarian investing. Align your belief with time frame (day trade , swing, position). Align your belief with right kind of market paradigm

Lot of time people claim they have discipline problem, but the basic problem is wrong beliefs and as a result wrong behavior. If you fix the beliefs discipline is comparatively easy. 

3/18/2014

Game changing catalyst offer explosive opportunity

On a daily basis many stocks go up on news. Not all of the news is worth paying attention to. But a special kind of news can help you find explosive move.


Game changing catalyst news fundamentally change the market participants view about the company and trigger a multi month or year rally. 


The objective of finding game changing catalyst stock is to find a stock that will increase your overall account by 15 to 20% in one trade. Which essentially means the stock should be capable of big move and you should risk sufficiently big on it.

Look for a game changing earnings surprise announced after hours or before market open. For this look at pre market gainers and last night after close gainers.

You want to see stock with neglect, that has significant first or second earnings surprise. If such surprise happens right at the beginning of a new rally then the move can last for weeks or months and the magnitude of move can be 50% to at times 1000% plus.

Big game changing catalyst kind of moves are Episodic Pivots that change the existing Wall Street perception about a company’s business and as a consequence its future price potential.

Earnings related Episodic Pivots are the most common and happen frequently. But they are not the only EP , biotech sector has its own kind of EP. Biotech move based on drug trial data. A loss making biotech can go up a lot on “potential” of drug approval which might or might not happen after many years.

Loss making technology companies also can at times go up based on future potential or sector moves. This tends to happen in later stages of bull moves.

From a practical process point of view focusing bulk of effort on earnings EP is good strategy as they are easier to understand.

The easiest way to find game changers is by running a volume expansion scan in Telechart and then research stocks to find out what triggered such big buying or selling. 


 In a day you do not get many stocks with huge volume surge and also up big. The few that do are worth examining in detail and if they have several months of neglect they offer best opportunities.

3/17/2014

In search of a static method

One of the common dream of many traders is to find a static and permanent  trading system with well defined rules , back test it and then  and execute it. They believe that once they find that then it is just a matter of discipline and psychology to stick with it.

In reality there are very few static systems like this. Systems continuously evolve and static system become outdated. Even in the quantitative world there are no static and permanent methods. the systems continuously evolve and adopt to market circumstances.

If you compare the game of trading to fishing , you will find the nature of fish available in the pond changes, the kind of fishing equipment changes, which affect your chance of finding fish if you don't change. The pond becomes too popular with many fighting for same fish. The pond dries up . The fish migrates. In effect the variables keep changing.

The traders who start with static view of the market are doomed to failure as they are making a basic assumption about nature of the game.

there were number of very popular strategies from 2003 to 2009 which stopped working and wiped out people trading that. The long only focused daytraders of 1999 got wiped out once market changed and the dot com era changed.

While basic tendencies of market remain same and larger structural edges remain constant there are subtle variations and good traders constantly tweak basic approach to account for that.

Larger edges like momentum, value, mean reversion remain valid but the specific application of that needs to be updated periodically. You will seldom find a trader trading same static system for decades.

3/13/2014

How to find the bubble stocks


From time to time some stocks catch investors fancy and in a very short period of time double or triple. In most cases there is some "hope" story behind these stocks. These stocks can make breath taking moves before collapsing.

Bubbles are more common when breadth becomes excessively bullish. These kind of periods are characterized by such irrational moves. To find these kind of periods look at the Market Monitor readings on Number of stocks up 50% in a month. When the readings climb over 20 you will notice big moves in many speculative stocks on marginal catalyst.


These readings seldom climb above 20. For months you will see readings below 20, but once they climb above 20 you will notice the big speculative bubbles on handful of stocks, especially on low priced stocks and stocks with questionable fundamentals. They will make bigger moves during this period as speculative juices are in full flow during such periods.

As a momentum trader looking for such speculative excess period can offer you some good lottery ticket opportunities on low priced stocks. All such stocks rise up in momentum ranking during this period.


3/12/2014

How to find stocks like JCP

stbi.png


Thomas N. Bulkowski has studied data from 1990 to 2008 on stocks that doubled . He found two key things:

● Stocks that double substantially outperform the following year 53% of the time.

● Stocks that drop 50% or more outperform the following year 68% of the time

The Half Trouble approach that I use is focused on stocks that drop 50% or more in a year. They are stock in deep trouble , but if suitable catalyst comes in they can go up several fold quickly. 

I start looking at these stocks once they drop 40% from 52 week high. In next one year or so some of those stocks go on to make explosive 300% plus moves.

JCP which we bought in in Working People Portfolio sometime back is a example of this kind of stock. As you can see in chart below, it was beaten down stock and down more than 50% from 52 week high. Everyone had a very low expectations for this stock. 

It was heavily shorted. A recent earnings news lead to the start of this move and stock is already up 90% from low. If the turnaround sticks, you are looking at further gains.


jcp.png


By systematically and daily tracking them and proactively looking for a possible catalyst we will be ready when the stock is ready to explode.

Stock go through expectation cycle. For  low expectation or negative expectations they move to extremely high expectation or darling status. 

At low expectations level they are neglected and at high expectations level everyone wants to buy them. They become market darlings. 

But the romance does not last and ultimately there are heart breaks and negative surprises. If you are looking for good short candidates do reverse of this and track stocks up say 500% plus. 

Sooner or later in next one year they will become good short candidates as the old darlings are dumped for the next young and pretty thing.

A previous post I wrote details this: Earnings expectations and Cinderella Strategy 


One of the biggest winner for last year for me was FB, it was also found using similar watch list. It got dumped more than 40% from IPO high and subsequently took off after earnings surprise.

fb.png
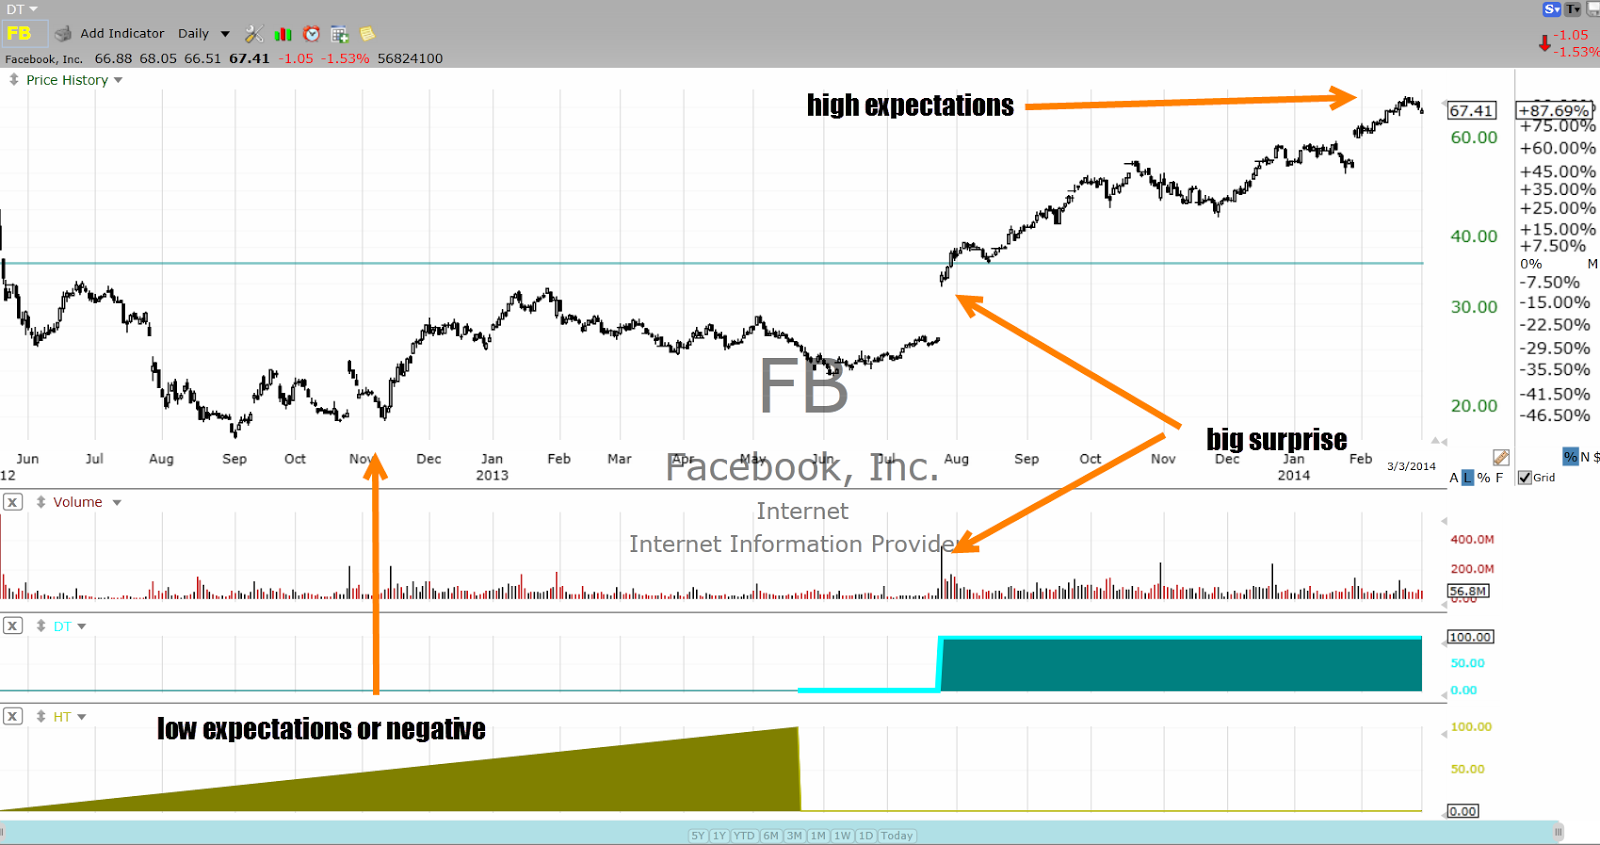
FB from neglect to market darling

This approach is more suitable for research based speculators with longer holding timeframe.
The first starting point in the Half trouble approach is to look at scan candidates and find out why they are down and is it because of secular reason or temporary reason. The secular trends will require long time to play out. The temporary variety are low hanging fruit.

Temporary setbacks get fixed easily and stock bounces back. While that kind of situation is good , it seldom leads to explosive multi month move. The big explosive multi year turnaround happens on the most neglected and stocks with big problem and negative outlook that manage to turnaround.

Stocks often bounce back once they get cut down in to 40% level, so in addition to scan you need to maintain a database . For example NUAN is now marginally up but it was a HT candidate few weeks ago and should still be tracked as that. You should be willing to track these candidates for more than 2 to 3 years. The one that spent long time getting cut are the most attractive candidates when surprise arrives.

One of the temptation will be to buy early. If you do that you will have portfolio full of duds that might get cut in half multiple times. You have to wait for catalyst to show up or buy just ahead of catalyst.

In addition to the stocks adding ETF that are down 40% plus from high will allow you to find ETF near their trend start.

I have a combined list of ETF and Half Trouble scan candidates I monitor daily:


Symbols from Half Trouble Universe I monitor

OXF
YANG
GFI
HMY
ARCO
ERY
EDZ
TZA
SRTY
OFIX
DGAZ
JCP
UVXY
CPL
HXM
FBP
ELP
ARO
ELNK
TVIX
TWM
MPO
MIDZ
FIO
SBS
DRD
UGLD
SPXU
SOXS
SPXS
XCO
FAZ
LBTYA
ASPS
KOLD
RSH
VXX
MHG
KOF
VIXY
VIIX
SQQQ
NUGT
EIG
EC
SDOW
PULS
EBR
CVOL
BIS
CALX
SKF
QID
CIG
TECS
OIBR
TFM
LBTYK
FSYS
AGI
BVN
RDNT
DSLV
UTIW
NEM
BWP
CVRR
USLV
PBR.A
GSEH
BXC
INTX
EMITF
AT
LDK
SGI
AGQ
ANFI
UNTD
DMD
QUAD
NTE
AEPI
CZZ ( largest sugar producer)
CLNE
JAKK
ZNH
EZPW
LFL
FRAN
GFA
ALDW
XNY
SFY
ADT
LULU
CDE
OSTK
NVTL
INWK
BSBR
KGC
BBY
HERO
WTSL
IAG
CCCL
SQM
GMAN
CLUB
PBR
CALI
YZC
RT
AVP
RCII
DUST
ACW
NBG
IOC
AAWW
RNDY
NTLS
AVNW
DRV
SHOS
NIHD
BIOS
TWGP
WTW
TUR
WAC
GOL
CVI
CETV
ICA
PBF
FST
XIN
CNCO
EROC
RNF
BIOF
RIOM
MLNX
MTL
DLLR
YRCW
MX
NUS
NSM
SODA
LF
RDEN
HGG
BTH
BBRY
END
VRS
TITN
RLOC
XXIA
USU
TC
JRCC
BGFV
ZA
SOL
RAX
DRL
LRN
EDMC
ANR
CONN
YINN
SID
HK
TECUA
HSOL
RUSL (keep an eye, this can bounce back 30 to 50% quickly)
CWTR
WLT
LINC
CSUN
APP
IO
CRRS
FFHL
ALSK
GSS
COCO
BONT
NES


Why are these stocks showing up in this scan? Can you classify them into groups. like below.

Some of the common reason for a big drop are:

1. excessive bullishness driving stock to unsustainable level resulting in subsequent drop

2. loss of earnings power

3. high cost

4. high debt

5. management changes

6. outdated technology

7. faulty business model

8. industry structure change

9. fashion or craze product loses appeal

10. overall economic slowdown

11. replacement product at lower price

12. mergers gone wrong

13. product recalls

14. natural disaster

15. regulatory action


Telechart Scan for Half Trouble

c<=.6*maxh252 and minv3.1>=30000

c= closing price today
maxh252= highest price in last 252 days
minv3.1= minimum volume in last 3 days

The scan gives you stocks that have gone down at least 40% from their one year high and that have last 3 days volume above 30000 for each of the day. Beaten down stocks can often become neglected and can have lower daily volume near bottom.

The scan will give lot of small caps stocks. I want to focus only on stocks with revenue above 300 million. The smaller stocks are more speculative and difficult to track. By focusing only on 300 million plus sales we can reduce the list to few focused candidates.


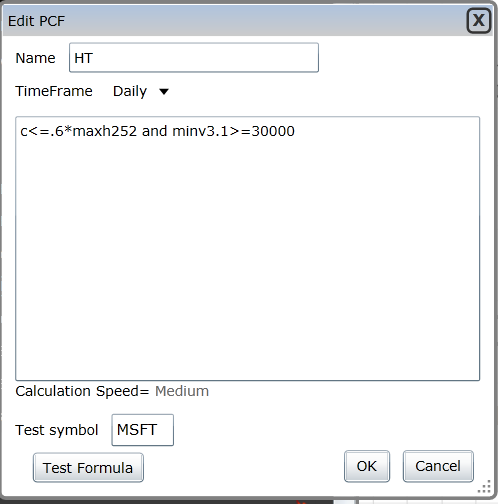
Chart Settings for HT

c<=.6*maxh252 and minv3.1>=30000


c>1.8*minl252


One of the limitation of Telechart 2000 is it only shows 2 years of chart, in older version you will see this better.

Those who are serious can set this up on your own. If you do this religiously, you will find 5 to 6 good ideas in a year that will double or triple once catalyst comes in.


bee.pngbee.pngbee.png