
Blogging will be light as I am taking a 3 weeks tour to investigate investment opportunities in a red hot international market.
A study by Ohio State University researcher Jay Zagorsky suggests marriage is good return. According to his review of 9,055 baby boomers, married folks accumulated net worths that were 93 percent higher than single or divorced individuals. And married individuals tended to experience average wealth increases of 16 percent annually.


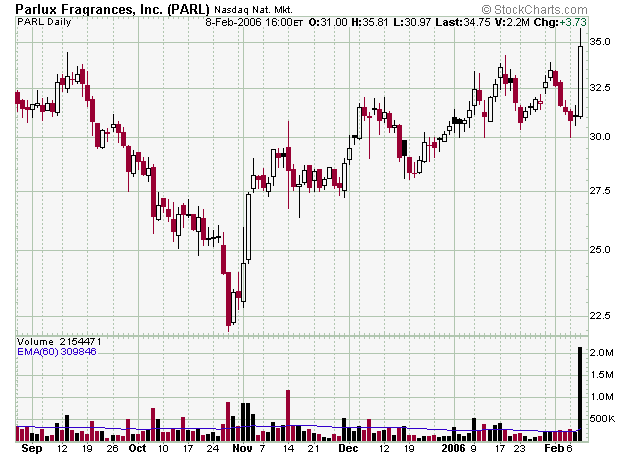
In early May of 2004, Parlux Fragrances (who have made fragrances for Guess, Perry Ellis, XOXO) announced that they would be releasing a fragrance line created by Hilton. The perfume would be aptly named "Paris Hilton". The scent was described as "a brilliant flirtatious charm, this head-turning fragrance can be dressed up or down for both day and evening wear." The scent consists of "an ethereal halo with delicious notes of frozen Apple and juicy Peach Nectar wrapped with sparkling Muguet and a splash of wet Ozone. A luminous bouquet of sensual floralcy is at the heart of this fragrance. Delicate Mimosa Blossoms are entwined with sheer Freesia and Night-Blooming Jasmine petals, while heady, rich Tuberose provides depth and texture."
The perfume launch was a success. Originally set to be a small release, demand became popular and they had a wide release before Christmas of 2004. The launch was a big part of the Parlux stock increasing 30%. Ilia Lekach, a CEO at Parlux, said "I am delighted with our record performance and I’m optimistic regarding results through the end of our fiscal year. We have recently commenced shipments of our Paris Hilton fragrance which has surpassed our expectations."
After the success of Hilton's perfume, Parlux Fragrances had her create Paris Hilton for Men, a cologne that has a "sensual aura." The packaging states: "Paris Hilton knows how she likes a man to smell, so she has created a scent to share with her male admirers around the world." The colgone is available at Lazarus-Macy's. Sales reports are not available.
Hilton's latest perfume is called Just Me by Paris Hilton. She claims there will be more to follow.
ALAN GREENSPAN, who stepped down last week as chairman of the US Federal Reserve after 18½ years, yesterday blamed the threat of terrorism for the soaring gold price, in his first private sector speech since being let off the leash of officialdom.
According to members of his audience of international investors — watching a holographic image in Tokyo as he spoke in New York — Mr Greenspan said that the high cost of gold did not reflect inflation or the strength of commodities, but rather a fear among investors of a major geopolitical conflict.
Greenspan contnues to torment gold bugs in his retirement!

As a speculator anticipating likely market direction can pay rich dividends. As I had been anticipating a market turn, on a day like yesterday I had no major long commitments.
To anticipate market turns I uses the price and volume relationship to derive a anticipatory indicator. Much of what I do is very similar to the market indicator you will find at Stockciphering.
I use similar logic to plot all indexes and have done few tweaking to the basic methodology used by stockciphering.
Besides that I have a proprietary leadership indicator which tracks the top 200 stock price volume relationships.


Today Marketwatch has story about Ford Equity research model showing the market to be overvalued. Ford Equity Research also has a free monthly newsletter which usually gives their take on market, sectors and their top picks. Their picks for this months newsletter are FE, LNC and PCP.
Their site has lot of free resources and useful research. I recommend strongly their research on development of their Ford Price Momentum Model.
Their finding shows:
Twelve months relative strength is good : you should buy the stocks that have the highest one year return and sell the stocks that have the lowest one year return.
One month relative strength is bad : you should sell the stocks that have the highest one month return and buy the stocks that have the lowest one month return.
Three months relative strength is also bad.
They have a formula for ranking stock using these criterias.
PRM = PGY -– PGQ -– 3 * PGN
With : PGY = 12 month price gain, PGQ = 3 months price gain, PGN = 1 month price gain. RPM= Relative Price Momentum.

Some speculators have pre defined prejudices against certain industries. Most believe in new technology but this three year sector ranking shows how the number one performing sector is the smoke stack iron and steel sector.
1 Steel and iron
2 Medical practitioners
3 Internet information providers
4 Bldg material wholesale
5 Ind metals and minerals
1 Steel and iron
2 Medical practitioners
3 Internet information providers
4 Bldg material wholesale
5 Ind metals and minerals
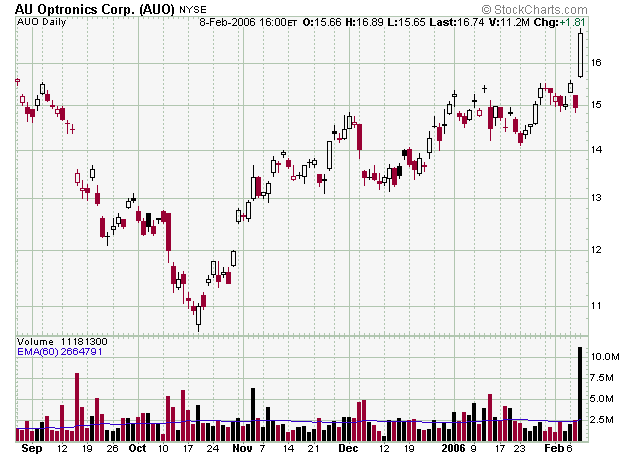
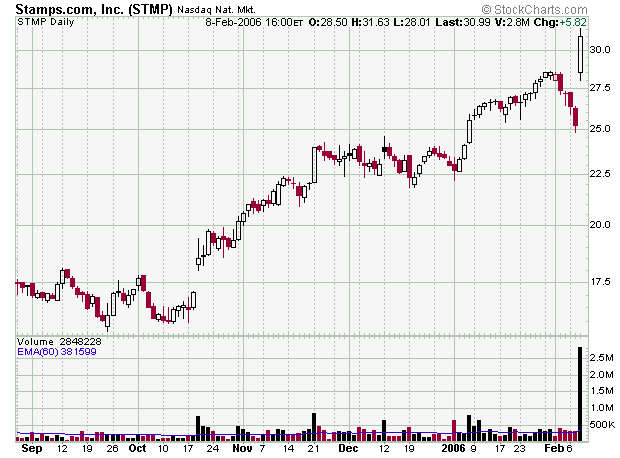
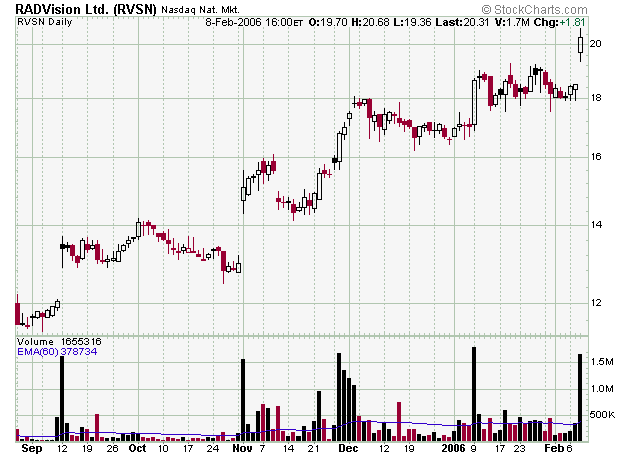
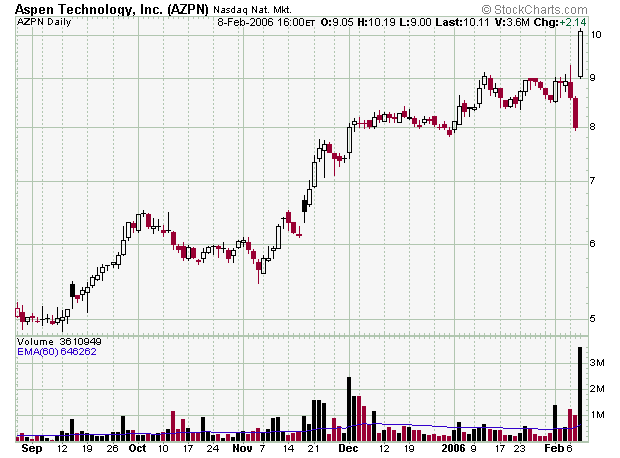
FXI ACH ASIA ASTT ASX ATS AUO AWRCF.PK BIDU BNSO CBA CEA CEO CHA CHDX CHINA CHL CHN CHNR CHT CHU CMED CMQ CN CNTF CRGI CTEL CTGLF.OB CTRP CYD DSWL GAI GRR GRVY GSH HIHO HNP HRAY HRCT.OB ICAB IMOS INTN IVN.TO JADE JOBS JRJC KONG LFC LONG LTON MXICY NINE NTE NTES NWD PACT PCLN PCW PEAK PTR RADA SAT SDAY SHI SMI SINA SNDA SNP SOHU SPIL SSPI SWG.TO TOM TOMO TSM UMC UTSI UUU XING YZC ZNH
I keep this list handy most of the time you can blindly buy them if they breakout on high volume. Most of these speculative move also correspond to late stage in bull move, giving signal of probable correction or reversal.
I keep this list handy most of the time you can blindly buy them if they breakout on high volume. Most of these speculative move also correspond to late stage in bull move, giving signal of probable correction or reversal.

With market up in January, its tough to be bearish. But lot of my indicators are signaling a top. The most prominent being break down in market leaders. The top usually takes a long time to form as one by one leaders stumble or breakdown while narrow group of stocks rise or more speculative names rise. I am personaly short the Russell Futures as of this week as a hedge against my long positions.
There is also the Presidential cycle as this article puts it nicely.
Sitting in a spacious office overlooking his firm's large trading floor, Ralph Acampora is worried. The head of research at Knight Capital Group says he's been having sleepless nights fretting about the stock market, despite its New Year's bounce. There's a long list of things that concern him -- mainly abstract concepts such as price patterns, trading volume, and seasonal trends -- that together make for a particularly gloomy forecast: Acampora is predicting the Dow will drop by as much as 20%, or as low as 8,400, this year. "At some point in 2006, we'll have a decline," he insists.
What has the chart readers so spooked is the "presidential cycle"--the theory that the market goes through regular ups and downs over the course of a President's term. This year is the second year of President Bush's second term, and second years tend to be rough for stocks. Since 1970, the second year of Nixon's first term, the market has turned down every four years, with the exception of 1986 (the drop came a year late in the '87 crash). In addition, some of the worst bear markets in recent memory--1962, 1974, and 2002--have hit during year two of the presidential term.
What's going on? The theory runs something like this: During the "honeymoon phase" of his first year, the President uses much of his political capital to push through legislation. By the end of year one, the new programs become less popular, the President's influence slips, and his poll ratings start to decline. Sensing weakness, the opposition party gets increasingly vocal as midterm elections in November approach. Consumer confidence wanes, the economy cools, and stocks tumble in anticipation of slowing profit growth. So far, Acampora says, this year is following the usual pattern, with President Bush under fire for the new prescription-drug plan and warrantless wiretapping, among other things.

While much is being made of earnings miss by YHOO and GOOG, the actual earning picture is very good for this quarter as this Zacks.com analysis shows.
The fourth quarter earnings season is almost halfway over. So far, 225 S&P 500 firms have reported. Despite some high profile misses, so far the results look pretty strong. Positive surprises have out numbered disappointments 135-42, with 49 hitting expectations exactly. The median growth rate of the firms that have reported is 14.2%. If this pace is maintained, it would mark the 15th straight quarter of double-digit earnings growth for the S&P 500. With 45% of the precincts in, we are prepared to make a call on this “election”. This was a good quarter for corporate earnings growth. With better than a three to one ratio of positive surprises over disappointments, it looks like it is shaping up as a landslide.
The fourth quarter earnings season is almost halfway over. So far, 225 S&P 500 firms have reported. Despite some high profile misses, so far the results look pretty strong. Positive surprises have out numbered disappointments 135-42, with 49 hitting expectations exactly. The median growth rate of the firms that have reported is 14.2%. If this pace is maintained, it would mark the 15th straight quarter of double-digit earnings growth for the S&P 500. With 45% of the precincts in, we are prepared to make a call on this “election”. This was a good quarter for corporate earnings growth. With better than a three to one ratio of positive surprises over disappointments, it looks like it is shaping up as a landslide.
On Tuesday, January 18, the yield on fifty-year inflation-protected U.K. government bonds (what the British call “indexed-linked gilts”) dropped to 0.38 percent, about one-seventh the historical average of just over 2.6 percent for such debt instruments. Just a few months earlier, that yield had been over 1 percent, still extraordinarily low by historical standards, and especially low in an economy that has experienced fifty-three consecutive quarters of positive growth. A yield drop from 1 percent to 0.38 percent on a fifty-year bond corresponds to a 30 percent rise in its price over a period of just three months. That is an annual return of over 100 percent, much higher than the 13 percent annual increase in U.S. house prices at midyear and the 20 to 30 percent gains seen in the stock market before the March 2000 crash. The asset bubble has spread to long-term government bonds, especially those with inflation protection. What is going on here?
Excellent commentary on worldwide interest rate trend and its implications
Excellent commentary on worldwide interest rate trend and its implications
Subscribe to:
Posts
(
Atom
)