10/26/2012

PSX: breakout to new high

One of the better looking setup today...


Setup is for possible short term bounce


It looked like a good setup for capitulation bottom for short term bounce was on card today. But the market has recovered from the negative bias pre market itself.
The RSI2 kind methods point to a bounce here and today the market might oblige. The tech stocks , leading to the downside seem to have priced in all the bad news temporarily and are positive in light of earnings miss.
This sets the market up for possible short term bounce..
The million dollar question will be whether the bounce has breadth....

10/25/2012

This is also the time to get your ducks in a row on your 401k strategy


Market continues to be under pressure. Selling breadth however is weak. We are looking at a slow sell off. Individual stocks that are missing earnings are getting taken to the cleaners. 
There has been a clear slowdown in earnings growth and especially revenue growth during this earnings season. That is being priced in to market.
However market is forward looking mechanism and it will move based on expectations of upcoming earnings in next 3 to 6 month. 
Corrections like this are healthy for market and lead to change of leadership. This is the time to start looking at potential leaders. Stocks which continue to be ranked high on momentum tend to lead the next up leg.
This is also the time to get your ducks in a row on your 401k strategy. The best time to make money in 401k is if you time entries with  market corrections and weakness. Market corrections give you that opportunity. The Stockbee Lemonade Strategy for 401k is up 20% year to date in restricted account with limited choice and up 56% in unrestricted account.  The strategy is currently 75% in cash. 
In the immediate  short run , the market is at extreme level as calculated by mean reversion indicators like RSI2. That tends to lead to bounce.
Bounce does not mean the downtrend has reversed or the correction is over.....

10/24/2012

Mean reversion methods indicate bounce likely

he market gapped down yesterday but did not follow through to downside during the day. In fact the Nasdaq managed to recover some of the gains.

Breadth was not overwhelmingly negative. As of now this continues to be slow grinding correction.

But the setups on individual stocks clearly show significant damage. Everyday more stocks are breaking down.

The individual one day moves dominated by earnings continue, but there has been no follow through on most earnings breakouts.

The overall picture looks like this correction will require  more time and more selling to play out. In the meanwhile after 3 to 4 days of negative action a bounce is likely outcome. 


The RSI 2 kind of mean reversion methods are in extreme territory on indexes, indicating a high probability of short term bounce exspecially on Nasdaq and small caps.

10/23/2012

The lack of conviction


A last hour bounce resulted in market closing marginally up for the day. But overall breadth was negative. That is a clear sign of lack of big player buying. Any move out of this range need a breadth thrust in either direction.

The big takeaway from the earnings season is clearly the Technology sector earnings. That has led to the sector selling off.

This rally was led by biotech and technology sector for few months now we are witnessing change of guard.
Absent big breadth day we may continue to be in choppy range till a catalyst or pre earnings season arrives for next earnings trends to be clear.
From 401k point of view a 8% plus correction or a severe shakeout will be ideal scenario. 

10/22/2012

Series of bad earnings

Series of bad earnings on large stocks and especially technology stocks have put the bounce attempt under pressure. After attempting to make a high the market failed. However indexes are still near recent high and the breadth trends have no sharply deteriorated. 

But the action on momentum stocks indicate likelihood of a correction. Most stocks that were ranked high by momentum have had range expansion to downside. Such range expansions do not reverse easily.

10/19/2012

Tech stock under pressure

Tech stocks and small caps is where the weakness is. Many of the big tech stocks have reversed or pulled back. They were the leader of this rally.

However money is rotating in to financials and metals stocks.

All in all a choppy move continues and may continue till election. 

10/18/2012

Approaching new high

Dow Jones 30 and S&P 500 are within 1% of new high. Market established a high in September after the Fed decision to keep rates lower for extended period of time. Since then markets have been range bound for 4 weeks. Now the large cap indexes are in striking distance of the high.

The Nasdaq and Small caps are the laggards. They are down 4% from high. The small speculative stocks are having tough time putting sustained rally together this year.

The earnings trends so far are in line with low expectations. As the season progresses more clarity will be possible.

As of now range expansion based swing trades on Triple ETF is what is working.


10/16/2012

A 5% correction in Nasdaq 100

In last 17 trading sessions the market has been in correction mode. The selling is concentrated in technology stocks. The Nasdaq 100 has been the leader to the downside and has had a -4.94% correction from peak to the low.


The breadth trends during this period show steady distribution. There has been no big breadth thrust to downside but first bounce attempt was aggressively sold. The buying on bounce has been very low. The breadth hardly moved on such up days. That indicates no rush to buy by big funds.


As you see , yesterday the market bounced back but breadth was 84/55. That indicates very low buy interest. A buy interest above 300 is worth taking note of. If we get that kind of breadth thrust in next few days then chances of this being small correction will be high. Absent that we might get another leg down. 


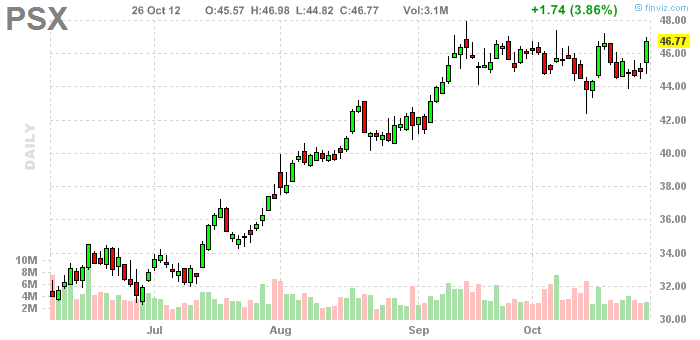
One of the better looking setup showing up in scans yesterday was WY (Weyerhaueuser). It is a play on housing recovery.


Are you serious about your trading?

If you are serious about your trading and want to build an enduring edge the Stockbee Member site might help you. Members tell me they have tried lot of things before coming to my site and it has offered them the most extensive and detailed methods to swing and position trade.

It is only for those who want to develop their own self sufficient trading method. It is not a stock picking service. It is service for you to build your own scans and trading method to have your own daily pick based on your method.

Be warned it will take you time to learn to trade. Learning to trade is difficult art and unless you are willing to spend months or years to perfect your strategy and also develop your mental edge you are unlikely to succeed in this game. Unless you understand that no site, no service, and no mentoring is going to work.

Why traders come to stockbee?

The member site is one of the most recommended site for learning to trade by other traders and bloggers. You will see no advertising, no hard marketing, no promotions, no free offers, no affiliate marketing, no incentive to other bloggers to promote the site, no constant twits self promoting the site, no free trial  and no tall claims of making you instantly wealthy, and yet the site attracts new  members everyday. Members come from all walks of life and all kinds of trading size and trading styles.

You will see that many trading bloggers have been using my market timing methods, scans , stock ranking lists and chart templates. They have developed their own methods based on my methods. Many paid newsletter site recommend my site to their subscriber for learning about trading and market.

Over the years thousands of traders have been members and those who benefited from the learning talk about the site to others or talk about the methods used and that is how new members learn about the site.


What will I learn in the members site?

The members site will give you in depth understanding to develop your own trading method. The emphasis is on making you self sufficient and confident of your own trading method and style.

As a member you will learn the basics of swing trading, momentum investing, growth investing and risk management.

You will learn about Stockbee Trend Intensity Breakouts method that uses momentum based swing trading to find 3 to 5 day swing trades for 8 to 40% profit.

You will learn about Stockbee Episodic Pivots Breakout method which uses Post Earnings Announcement Drift (PEAD) to find stocks that had a game changing earnings and that are likely to rally for 3 months to 12 months.

You will learn about  Stockbee Dollar Breakout method that uses momentum, range expansion and swing trading approach to find 5 to 40 dollar moves in high priced stocks.

You will learn about  Stockbee Lemonade Strategy for 401k which uses market timing and momentum to invest in 401k. You will get weekly update on how I am using the strategy on our 401k to do allocation decision.

You will learn about Stockbee Market Monitor method for market timing using breadth. It allows you to avoid risky periods in market and allows you to identify market turns. It is used for 401k allocation decisions.

You will learn about Stockbee Double Trouble method to find stock with confirmed upside momentum using anchored momentum and that are likely to continue their up move.

You will learn about Stockbee Night Time is Right Time method to find news catalyst based trade ideas for short term day trade and swing trade.

You will learn about Investor's Business Daily’s IBD 200 list and how it can be used to find swing trading candidates for explosive moves.

You will learn about Telechart 2000 and how to use it effectively to scan for swing and position trade ideas and to set up your 401k strategy.

You will learn about Jesse Livermore Range Breakout, Darvas Box setup, and many other member shared methods.

You will learn how to set up your own scans, select right kind of stocks, how to set up stops, when to enter , when to exit, how much to risk, how to track your trades and all other details about trading. You will learn about developing your own methods and not relying on others for trade ideas.

The site has hundreds of videos and trading methods and variation of methods. Members help each other in developing the methods and share actively their research and finding. A collaborative spirit allows you to get input from others on your trading ideas or problems.

The site gives you opportunity to interact with some of the most successful traders and learn from them about their trading methods. It is a vibrant community with members from different background and experience willing to help each other. The emphasis is on continuous learning and up gradation of market knowledge and setup knowledge. The members range from hedge fund employees, financial advisers, active swing traders, investors and new traders.

If you are looking to develop your own trading strategy the membership site might be for you. You have to be willing to put in the effort to build your own method. There are no silver bullets offered on members site. Every method, every scan, every nuance is detailed and all possible help is offered to design your own method.

Do you have a trial?

If you are just looking for trial you are better off trying thousands of other trading sites that offer free trial or one month trial and offer you promise of riches.

It is for those who are ready beyond the trial phase and ready to put serious months or years  of efforts to learn to trade on their own. It is for those who want to learn to find their own fish.

The free blog has all the details about the methods I trade and if you go through the posts highlighted in the sidebar you will learn about them.


How can I become a member?

To sign up go to www.stockbee.biz and follow the sign up process. The site uses Paypal for payment processing.

10/15/2012

The earnings crush

This is a peak week for earnings announcements and around 40 large caps will be announcing the earnings. For next 3 weeks most moves will be driven by earnings.

The market continues to be under pressure and breadth continues to deteriorate. As of now selling has been slow. A weak bounce here might set up the market for further selling. 

10/12/2012

Another down day


That was the story of the day. A gap up that was wiped out by end of the day. The market continues to be in down trending mode. However with 5 down days in a row a sharp bounce may not be out of character. Down moves tend to be punctuated by many counter trend bounces.

10/11/2012

4th straight day of losses

Market was down 4th day in a row. A small attempt at bounce early was quickly met with selling and the market spent rest of the day selling off.  However in breadth term it was not a very high intensity selling.

The absence of high intensity selling during this correction may be a sign of no hurry on part of big investors to hit exit button. That also indicates likelihood of the market making another attempt at new high after digesting these gains.

If the low intensity selling continues it points to a more orderly pullback near high and may not be a bad idea. It will allow the market to setup in last quarter to make a high.

In this market the bears have had hard time sustaining a big down trend. So we will see how it goes. The focus should be on stocks holding up well and forming nice setups during this correction.

10/10/2012

Task cut out for dip buyers

Every time the market has had 2 to 4% weakness in last couple of months, the dip buyers have been extremely aggressive. Will they show up in force again.


In last 14 trading days we have seen a series of low intensity distribution days. This is primarily focused on technology sector.


At this stage all eyes are on earnings and the earnings trends will be more apparent next week as more companies announce earnings.

This is not the time to be aggressively long on momentum setups. A correction needs to play itself out and better setups need to show up for sustained bull move.

10/09/2012

Low volume pullback

In last few weeks the market has been in holding pattern. There are signs of distribution in some technology stocks. But nothing major .

Breakouts on upside are not having vigorous follow through. Many end up giving up intra day gains.

The market will need a catalyst to get out of this phase. The earnings season has started this week and that should act as a catalyst. The earnings are expected to be worst earnings so far since the market put a bottom in 2009. Let us see how market will react to that.

One positive for the market is the low interest rates and Fed pledge to keep them low. 

10/04/2012

It is a stalemate

Market is stuck in a narrow range post a pullback. The selling follow through has been weak. Every time sellers attempt to take down the market buyers step in. Net result is a stalemate at this stage. A catalyst can change that equation.

In this market for many months pullback buying has worked and buyers are conditioned to do same. With less than 2.5% pullback on the indexes, it is still an appealing pullback setup.

Under the hood there is lot of sector rotation happening. The Energy sector has clearly lost its mojo. Number of stocks in that sector are reversing from their recent rally. This is in line with the sharp reversal in oil prices in recent days. Semiconductor is another sector which has been in downtrend.

On the positive side sectors gaining momentum are : hospitals, silver, long term care, home improvement stores, biotech, resorts and casinos.

The banking sector had lot of banks attracting buy interest in recent weeks. Banks like C, WFC, sti, and likes had buying interest yesterday. JPM is one good setup in that sector. The stock looks ready to breakout.


10/03/2012

Natural gas, gold, silver and India are gaining momentum

Markets opened strong and ended up giving gains and going negative for rest of the day. Last one hour saw a bit of buying. End result was small gain on some indexes. This is a repeat of what happened just day ago. From September 25 onward every rally attempt has faded. The downside momentum however has not been strong. As a result the market is going sideways in a narrow range.

Individual stocks have a different story based on catalyst and sector. Some stocks have gone down a lot during last month. Stocks like INTC, BIDU, MSCI, CLB, JCP, HPQ, GMCR, NSC, STX, BBY, X and so on have been lagging the market. While stocks like PCS, KBH, CRDN, LEAP, JAZZ, CVI, WAC and the likes have done well.

The market is waiting for next set of catalyst. The rally was driven by hope of Europe stabilization and Fed action. The European markets were the best performing markets in last couple of month. The beaten down markets like that of Spain and Italy made big move coming out of bottom. The Emerging markets are showing some life. The Indian market driven ETFs like EPI and PIN have made big moves in last few weeks.

On the commodity side the Gold, silver and natural gas ETF have been best performers. The top 30 ETF ranked by momentum are all dominated by them. Many of these ETF are consolidating near high and likely to make another up move once the consolidation is over.

Top Ranked ETF by momentum:


  1. ugaz
  2. nugt
  3. uslv
  4. boil
  5. agq
  6. sil
  7. ung
  8. xiv
  9. svxy
  10. gdxj
  11. gdx
  12. slv
  13. pslv
  14. dgp
  15. epi
  16. soxs
  17. pin
  18. dbb
  19. edc
  20. urty

10/02/2012

Pullback at work

Markets have struggled in last two weeks after making a choppy 15% move from June low. The move from June low was characterized by many choppy phases. 3 to 4 days rally was followed by 3 to 4 days pullbacks. There were not many back to back 5 days plus up moves.

The market was expecting the Fed decision. The Fed did not disappoint the markets. But after the Fed decision market has struggled. With a powerful catalyst what happens after the news is important. It indicates how the market views the strength of the catalyst. Instead of rallying the market has pulled back. That indicates the market views that Fed decision may not be major game changer.


In last 8 days we have had 4 distribution days on the Stockbee Market Monitor. There was 1 day of stalemate where buying and selling pressure was equal and 3 days of modest buying. The Market Monitor is a market breadth indicator which tells you about underlying buying and selling pressure and it allows you to time the markets. Prior to this pullback it was indicating extremely positive breadth and probability of a pullback. The markets have acted as per the script.


The Market Monitor signal is very useful for 401K investments. It allows you to get invested at right time and get out of the market at right time. During this bull move the Stockbee 401k lemonade strategy got fully invested on 2nd July and stayed in this move till 21st September 2012. The strategy locked in 20% profit during the move and currently is in cash. In all funds option the strategy locked in 56% returns.

What next for the markets? To resume a rally from this level we will need to see a big breadth thrust. Absent that watch carefully for breakouts and new high failure. During such transition periods the breakouts often fail immediately and new high get faded. You will see that dynamics at work. Eventually if this pullback has to work we will see sector rotation. New sectors will start breaking out and take on leadership. As of now the current leaders of this rally are witnessing slow deterioration.

Next week onward the earnings season will officially kick in with Alcoa being the first large cap to come out with earnings on October 9th. Earnings trends and guidance  will be key factor in deciding the fate of this rally.