4/30/2014

breakout anticipation setups for April 30, 2014


During market correction some stocks resist the selling and setup for further gains once weight of the market is lifted.


HDB is one of the examples of kind of setup to look for on stocks with established momentum that are ready for breakout. Any high volume range expansion in these stocks offer you good swing trade entries. 

List of stocks with established momentum I am monitoring for possible breakouts.


Know your market leaders

Market leadership constantly changes as some stocks start losing momentum and new stocks gain momentum.

A momentum ranking method keeps you on top of market leadership on daily basis. The Stocksbee 50 lists give you current market leaders using different Timeframes.

The top 50 stocks are ranked by one year leadership. Those stocks can often offer good swing trade opportunities on both long and short side. Some of them also give you position trading opportunity if they go sideways for extended period and then breakout.

The 65 days leaders give you Quarterly leaders. Some of them go on to make multi quarter moves , some fizzle out. The 21 days leadership gives you the fast signal. If a stock is starting a big move, it will often show up here first. Similarly a stock way extended and due for correction will also show up in 21 day ranks.

Most swing traders look for fast moving stocks. if you are going to hold a stock for 3 to 5 days, you want to be in the stocks moving at fastest velocity.


4/29/2014

Situational Awareness (SA) can save you money


As a swing trader you should be constantly reassessing the situations around you. The objective is to find favorable periods and avoid unfavorable periods. Or change your tactics based on how the market conditions are likely to be in next 3 to 5 days.

Situational Awareness (SA) helps you avoid stupid mistakes or avoid big drawdowns. You are constantly scanning the environment for danger signal or favorable periods.

This is inherent part of being a swing trader. Even day traders need situational awareness as market behaves different in different situation. A conscious effort at developing SA will pay you life time dividend.

Breadth is one of the tools that helps you develop SA as it can warn about possible dangers or turns. For example when number of stocks up 50% plus in a month climbs above 20 , it indicates possibility of a correction or reverse of that is when 20 or more stocks are down 50% plus. Other intraday breadth indicators do similar job.

Historical studies is another way to  build SA skill. As you would have read today Tuesday turnaround is historical tendency and traders should be aware of that.

Similarly lot of historical tendencies like bounce after 3 to 4 days of weakness in indexes during bearish phases help you tactically manage your shorts.  If you are short and indexes are down 4 or 5 days in a row taking profits or tightening stops is what SA would help you do

Writing  down your SA daily can be good way to develop the skill and then comparing the days action with your SA raed, helps you fine tune your  . Habit of doing that will help you build a lifetime skill.

Think of SA as like daily weather readings. Today morning if the weather says 40 centigrade and winds of 10 miles per hour, knowing this you would wear appropriate clothes for your morning run. If weather indicates tornado and heavy rain , you will be prepared for it.

Same way Situational awareness is must have skill for short term traders. It can save you lots of grief and money. 

4/28/2014

More selling pressure


V bounce is now becoming inverse V.

Momentum massacre continues and shows no sign of stabilization as of now.

But the selling still is narrowly focused on stocks that went up a lot in last 18 months.

This correction was overdue and is part of normal market action. In last 18 months the extensive Fed support created a abnormal market action.

A 10% or more correction would set the market up for another up leg in this market in second half of the year.

The trick is not to get wiped out or take big draw downs during these periods. As you might have read some trading bloggers are down 30% plus in last few weeks. That is not a very good situation to be in.

If there is more downside, it will be punctuated by many bounces and will be very volatile.

4/25/2014

Setup selection involves purposeful sacrifice.


There is a diner next to my house, if you go there you will find a menu that runs 10 pages.

They have all kinds of choices available.

Guess what, most food their sucks.

Because in order to cater to every taste they make all kinds of food from Italian to American to Greek to southern cajun to you name it. How can they be good at so many things.

Don't focus on too many setups . Do few things extremely well.

If you see most successful investors or traders they trade one time frame and one or 2 setus well.

Warren Buffett does value investing, why doesn't he do day trading, or momentum trading or growth investing or high frequency trading.

Seykota does trend trading, why doesn't he do other styles.

Minervini does growth and momentum and within that two or three setups, why doesn't he do other things...

Similarly if you talk to very successful traders  they do few things well.

Purposeful sacrifice is first step you need to do and narrow your focus to few things....


Wait for your setup to show up instead of constantly changing your method

Define your setup in great detail.

Do all the thinking when you decide to trade a setup.

Convince yourself that you can make money using this setup logic.

Study thousands or ten thousand past examples before trading it. Get every detail about the setup etched in your mind.

Effort involved is significant in this but is one time. After that wait for the setup to show up and pounce.

As against that what do you see here day in and day out.

Brownian motion.

Someone says Bollinger band or keltner Channel , everyone runs for them.

Someone says NFLX is position trade everyone runs for it.

Someone says buy mean reversion everyone runs in that direction.

Someone buys ODMAX in 401k everyone runs to buy it without thinking.

Someone says rich get rich by buying beaten down stocks, everyone runs for it

Someone says pivot point again mad scramble to get scan for it.

Someone says John carter indicator, then everyone goes crazy for it.

In the process you are just flirting from one idea to another one setup to another, without getting in to depth of any one thing.

Monday to Friday if you rotate through 5 different setup ideas you will end up confused and frustrated.

You will never develop expertise on a setup with that approach. Setup selection involves purposeful sacrifice.

Lot of effort is spent in chasing mirage instead of mastering a setup.

Learn from this very good observation by Ed Seykota on setup

The lizard ... just hangs around on the rock ... and waits and waits and waits ... for his pattern to show up ... and when a bug comes along, he makes his move, right from the gut, without thinking about it.

Moral

When trader becomes that automatic, then he, too, can hang around on a rock and catch a lot of bugs.

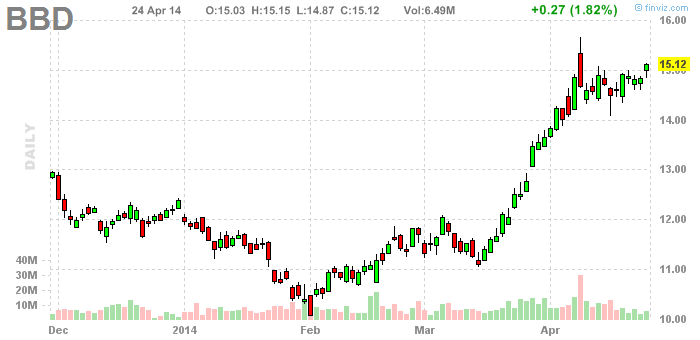
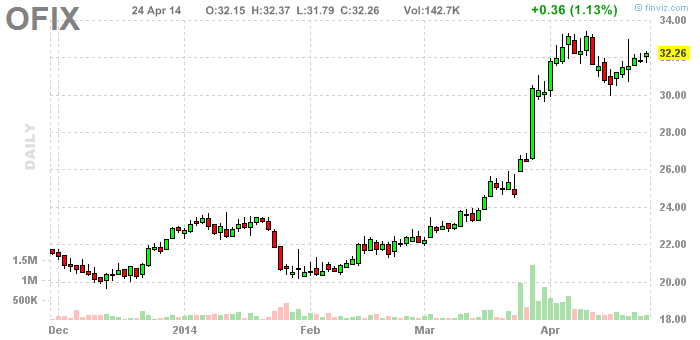
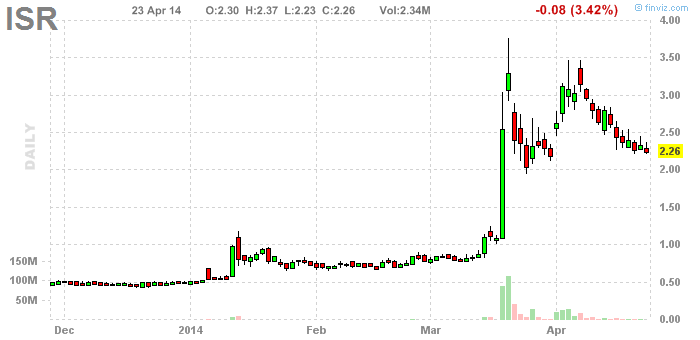
If your setup definition is Stockbee momentum burst , you wait for setup like GOL to show up and pounce.

If your setup definition for 401k is Stockbee Lemonade strategy for 401k,  you wait for mutual fund to show up in your TI42 rank and pounce.

If your setup definition is anticipation then everyday you look systematically for that setup and pounce when you get god setup.

If your setup definition is Stockbee Episodic Pivots , you wait for it to show up and then back up the truck and buy....

If your setup selection is right you will have less of psychological issues.

Clarify and re clarify your setup to a level where the setup and trader becomes one.

Breakout anticipation setups for April 25, 2014

As market tries to recover from the 8 to 9% correction, focus is now shifting to new set of momentum leaders.
These are some of the stocks I am monitoring for possible breakout in next couple of days.

http://www.finviz.com/chart.ashx?t=AER&ta=0&ty=c&p=d&s=lhttp://www.finviz.com/chart.ashx?t=ALIM&ta=0&ty=c&p=d&s=l

http://www.finviz.com/chart.ashx?t=APC&ta=0&ty=c&p=d&s=l
http://www.finviz.com/chart.ashx?t=BBD&ta=0&ty=c&p=d&s=l
http://www.finviz.com/chart.ashx?t=BMO&ta=0&ty=c&p=d&s=l
http://www.finviz.com/chart.ashx?t=BSBR&ta=0&ty=c&p=d&s=l
http://www.finviz.com/chart.ashx?t=CBD&ta=0&ty=c&p=d&s=l
http://www.finviz.com/chart.ashx?t=DHT&ta=0&ty=c&p=d&s=l
http://www.finviz.com/chart.ashx?t=EIX&ta=0&ty=c&p=d&s=l
http://www.finviz.com/chart.ashx?t=EXC&ta=0&ty=c&p=d&s=l
http://www.finviz.com/chart.ashx?t=EXH&ta=0&ty=c&p=d&s=l
http://www.finviz.com/chart.ashx?t=FRX&ta=0&ty=c&p=d&s=l
http://www.finviz.com/chart.ashx?t=HDB&ta=0&ty=c&p=d&s=l
http://www.finviz.com/chart.ashx?t=HII&ta=0&ty=c&p=d&s=l
http://www.finviz.com/chart.ashx?t=IGTE&ta=0&ty=c&p=d&s=l
http://www.finviz.com/chart.ashx?t=ISR&ta=0&ty=c&p=d&s=l
http://www.finviz.com/chart.ashx?t=NOA&ta=0&ty=c&p=d&s=l
http://www.finviz.com/chart.ashx?t=OFIX&ta=0&ty=c&p=d&s=l
http://www.finviz.com/chart.ashx?t=PEIX&ta=0&ty=c&p=d&s=l
http://www.finviz.com/chart.ashx?t=SBGL&ta=0&ty=c&p=d&s=l
http://www.finviz.com/chart.ashx?t=SEM&ta=0&ty=c&p=d&s=l
http://www.finviz.com/chart.ashx?t=SQM&ta=0&ty=c&p=d&s=l
http://www.finviz.com/chart.ashx?t=STE&ta=0&ty=c&p=d&s=l
http://www.finviz.com/chart.ashx?t=TSEM&ta=0&ty=c&p=d&s=l
http://www.finviz.com/chart.ashx?t=TTM&ta=0&ty=c&p=d&s=l
http://www.finviz.com/chart.ashx?t=WG&ta=0&ty=c&p=d&s=l


These are stocks with established momentum that are either going sideways or having orderly pullback. Any breakout will signal start of new momentum phase.

You can find complete list of stocks I am monitoring here.

The velocity of V bounce slowed down


The velocity of V bounce slowed down in last few days as it encounters selling after oversold bounce.

New leadership might be emerging in new sectors and new stocks not on most people's radar as they continue to focus on old momentum names.

To find new leadership look at stocks ranked in top 50 or 100 by TI65 or TI21. Many of them are forming sideways patterns and some are having breakouts.

Old leaders with V bounce are candidates for short sell as they run out of gas after bottom fishing and short covering is over.

Earnings are not producing the same oomph as earlier . Good earnings are often running in to skepticism.

In spite of damage to momentum leaders the big stocks and S&P and DJ 30 stocks still holding gains.

At this stage this looks more like range bound action.

From a trading point of view opportunities on both long and short side are present currently. 


4/24/2014

GOL : Breakout near new high

Slowly new leadership is emerging in the market. Stocks that held up well during the correction are now beginning to breakout.

GOL is an example of that today. GOL is brazilian Airline . After a first up leg in mid march it consolidated near high and is breaking out today. If it follows through 7 is my target on this. Stock showed up in anticipation scan couple of days ago and had a breakout today on high volume.


In it with close stop . More setups like this have started to show up in recent days.

Anticipation Setups I am currently monitoring.

Breakout Anticipation setups

Stocks having orderly pullbacks or sideways action during the correction . These stocks have established momentum and can breakout to upside in next few days.
http://www.finviz.com/chart.ashx?t=ISR&ty=c&ta=0&p=d&s=lhttp://www.finviz.com/chart.ashx?t=OFIX&ty=c&ta=0&p=d&s=lhttp://www.finviz.com/chart.ashx?t=YRCW&ty=c&ta=0&p=d&s=l


http://www.finviz.com/chart.ashx?t=FRX&ty=c&ta=0&p=d&s=lhttp://www.finviz.com/chart.ashx?t=TQNT&ty=c&ta=0&p=d&s=l
http://www.finviz.com/chart.ashx?t=SEM&ty=c&ta=0&p=d&s=l
http://www.finviz.com/chart.ashx?t=EIX&ty=c&ta=0&p=d&s=l
http://www.finviz.com/chart.ashx?t=BBD&ty=c&ta=0&p=d&s=l
http://www.finviz.com/chart.ashx?t=APC&ty=c&ta=0&p=d&s=l
http://www.finviz.com/chart.ashx?t=BMO&ty=c&ta=0&p=d&s=l
http://www.finviz.com/chart.ashx?t=PQ&ty=c&ta=0&p=d&s=l
http://www.finviz.com/chart.ashx?t=CBD&ty=c&ta=0&p=d&s=l
http://www.finviz.com/chart.ashx?t=TTM&ty=c&ta=0&p=d&s=l
As you can see slowly more and more stocks are setting up for next up leg. If overall market gains traction these stocks might lead the action.

At this stage the action is dominated by oversold bounces. That trade is now almost over as most things that had to bounce have bounced back. Some of those bounces are forming good short setups.

4/22/2014

It can bounce but can it rally big

Indexes are masking what is happening below the surface. They are approaching new high but breadth does not support the new high. If you look at the Market Monitor Breadth figures, you will see that they are in negative territory. The damage done by selling is not being reversed. Such divergence often leads to lower prices.

If you look at most sectors, they are in confirmed downtrend and the bounces have not reversed those downtrends yet. Technology, financials, retail, biotech, software are all in correction mode and the weak bounces on them so far do not show bottoming action.

The defensive sectors and energy are best performers currently. I will look for setups on them for swing trading.


4/21/2014

The bounce may not stick


After many months with no 8% plus correction , we finally had a multi week 8% correction in Nasdaq and small caps.

Individual momentum leaders have taken bigger hits. As you can see at one stage last week 215 stocks were down 25% in a month.

In last couple of days the market has attempted to bounce back on low breadth. That might be sign of in short run selling is over and market might attempt to form a range. 

Because breadth was low the bounce may not stick.

4/09/2014

Small profit more frequent trades or big profit less frequent trades

3 day swing trade in CF

One of the constant question faced by new traders. They constantly shift from one end to another. Last night I got two emails and that had me thinking about this.

One person wants to only swing trade few triple etf while the other wants to only focus in finding stock likely to double. Focusing on less number of things will make higher returns or improve focus is the basic assumption.

Having thought about this issue a lot and researched it a lot in last decades , my view is the more opportunities a trading method produces better it is. Given a choice a method that produces 1000 trades in a year is better than a method that produces only 10 trades in a year.

A swing trading method or day trading method that produces frequent trades has big advantage over methods that trade less frequently even though the profit per trade is small. For example in the above CF trade I risked 254 dollar on a trade in a 110000 account to make 672 dollars in 2 days. In a year I am happy to find 500 plus trades like these and risk small amount. With commission cost being so low, it is better to trade frequently. For example in above CF trade my commission was 4 dollars. That is insignificant cost. 

A trader who focuses only on finding big opportunity has to bet significantly higher per trade to ensure higher returns. That significantly increases risk.

While a swing method that produces say 10 trades per day with lower per trade profit is significantly better as long as it has net profitability over large number of trades. Currently 53% of my trades work and give me 2.05/1 risk/reward. Then it becomes a task of finding more trades. Higher the number of opportunities, better it is. More trades you take with say 53% expectations level better it is as you can bet just .25% and still make good returns by increasing number of trades.

While everyday I look for a big opportunity trade like FB which made over 70% return on one trade last year , I am more focused on finding the small opportunities. The big trade is a bonus if it comes along, I will definitely take it.But as these trades require big risk if they do not work out , finding next opportunity involves long wait periods. 

Grinding out profit using swing trading is less risky due to small per trade risk as long as you have profitable method and it produces large number of trades. that allows you to increase your account in small but frequent increments and is less stressful. 

For a new trader who is just starting out this is even more important . Frequent trading with low risk allows you to build your skill faster than a less frequent trade method. It is also the reason most of the wall street and quant traders use high frequency trading methods with low per profit trade. With commission cost being so low, it is better to trade frequently. 

4/08/2014

Looking for new leadership


JVA: Coffee Holdings Co

After few days of correction as of now market is attempting to stabilize here. Many beaten down stocks are bouncing as bargain hunters and mean reversion traders look for that kind of trade.

There is another kind of trade where new leadership can start emerging. They are stocks that did not get affected during the selling and had low volume orderly sideways moves or pullback near the high. They can be first to start rallying once weight of the market is lifted.

JVA is one such stock I bought today. it had orderly pullback after recent high volume earnings breakout. Today it is breaking out. 


4/07/2014

Market setting up for a larger pullback


Market setting up for a larger pullback than we have seen so far in 18 months.

Momentum and growth names have entered correction zone and unlike previous corrections of 5 to 6 % , they do not show orderly pullbacks or continuation setups.

But markets do not go straight down, so there will be in near future a bounce and after that more failures.

Once the faster phase of selling is over, selective long work as market starts rotating in to new names. Those stocks that break down after a counter trend bounce offer low risk short setups.

The above action likely if we get multi leg pullback. So far in last 19 months we have had only one leg corrections.

While yet another miracle of V shaped recovery is possible , it based on setups looks like a lower probability event.

4/02/2014

How to find big opportunities during coming earnings season


Everyday hundreds of stocks release news before and after hours. These news releases can lead to stock making big move for the day. What you have to look for is extreme surprise or growth.

A big surprise on neglected stock or stock with low expectations leads to big multi quarter move...

Some quarter back FB offered such opportunity on earnings day. 


FB was a low expectation stock and the sentiment was it has missed the mobile ad bus. A big surprise made analyst eat crow. Since then it has gone up.

If FB has smaller float it would have gone up 300% plus by now on the basis of big surprise.

Earnings season is starting so look for big explosive earnings surprises. The information to do this is easily available and for those looking for explosive returns this is one of the best way to get in to stock right near start of its big move.


4/01/2014

How to find new leadership

Money finds new sectors to rotate in to during correction. That is what is happening right now.

Money has come out of  biotechnology , drug , China, and technology sector. Many of the stocks in these sector were up a lot in last six month , now they are having much needed correction. Some of them will go up again, some will never make it back to their high.

As a momentum trader and swing trader you have to look at where the new momentum leadership is developing. In any trading software it is not very difficult to do this.

In Telechart you can run a scan :

c/c10>=1.08 and minv3.1>100000 and c>5

Where
c= price today
c10= price 10 days ago
minv3.1= minimum volume in last 3 days as of yesterday

This gives you stocks that are up 8% plus in last 10 days. That gives you good idea of where money is flowing .

As a swing trader I look for 8 to 20% moves. This scan gives you stocks that in past 10 days had that kind of swing moves.

You can run a similar bearish scan :

c/c10<.92 and minv3.1>100000 and c>5

Besides the above two scan I also run a Dollar move in last 10 days scan to find stock up or down  at least 10 dollar. Higher priced stocks may not get captured in a 8% move scan, the dollar scan captures those movers.

If you go through stocks appearing in the two scans you can figure out where new leadership is no both bullish and bearish side.