2/28/2007

Double Trouble

Market bounced back after yesterdays carnage. The market will take some time to reveal its intended direction. In the meanwhile earnings based breakouts had a good day today. In most circumstances a good earnings always creates excitement. Those who understand the earnings game are quick to jump on such opportunities.

Market Monitor

Total 4% plus bullish breakouts=105
Total 4% plus bearish breakouts=56
65 day bullish/bearish ratio= 677/279
Stocks up 50% or more in a month=7
Stocks up 25% or more in a month=64
Number of stocks with 100% plus move =321
Number of stocks up 200% or more = 69
4% plus signals for 100plus universe=21
4% plus signals for 200plus universe=5


Select stocks which had 100% plus move in last 260 days from the low and which are up more than 4% on higher volume. Today's minimum volume is above 100000. To understand how to trade this see my earlier post "How to find a stock which makes 1500% move in a year"

AKS,Ak Steel Holding Corp (Google  Yahoo  Earnings  Chart
AMSF,Amerisafe Inc (Google  Yahoo  Earnings  Chart
ANGN,Angeion Corp (Google  Yahoo  Earnings  Chart
APAC,Apac Customer Services (Google  Yahoo  Earnings  Chart
CBLI,Cleveland BioLabs Inc (Google  Yahoo  Earnings  Chart
CLN,Celsion Corp (Google  Yahoo  Earnings  Chart
DECK,Deckers Outdoor Corp (Google  Yahoo  Earnings  Chart
GNLB,Genelabs Technologies (Google  Yahoo  Earnings  Chart
ICE,Intercontinental Exchange Inc (Google  Yahoo  Earnings  Chart
ICGN,Icagen (Google  Yahoo  Earnings  Chart
NETC,Net Servicos De Comunicado Ads (Google  Yahoo  Earnings  Chart
OFI,Overhill Farms Inc (Google  Yahoo  Earnings  Chart
PRKR,Parkervision Inc (Google  Yahoo  Earnings  Chart
PTT,Vcg Holding Copr (Google  Yahoo  Earnings  Chart
RBY,Rubicon Minerals Corporation (Google  Yahoo  Earnings  Chart
SGXP,SGX Pharmaceuticals (Google  Yahoo  Earnings  Chart
SUNH,Sun Healthcare Group Inc (Google  Yahoo  Earnings  Chart
SWIM,Investools Inc (Google  Yahoo  Earnings  Chart
VSNT,Versant Corporation (Google  Yahoo  Earnings  Chart
VTO,Vitro Sociedad Anonima (Google  Yahoo  Earnings  Chart
WHT,Westside Energy Corp (Google  Yahoo  Earnings  Chart


Stock in the Focus


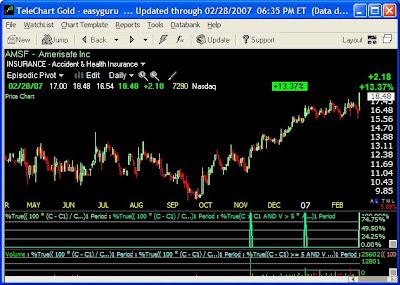
Amerisafe Inc is a 2006 IPO. It has been up over 113% in last 260 days. The stock broke out few days after earnings in November. Stock has had 5 quarters of triple digit earnings growth. My research shows Episodic Pivots on young companies have high probability of success if backed by earnings.

How to find high probability shorts

If you want to find shorts with 5%-20 opportunities, there are many ways to do it. Those are normal pullbacks in most stocks. But if you want to find long duration plus more profitable 30% plus kind of shorts, the task is slightly more complicated.

The reasons are obvious. Unless you are genetically predisposed to bearish strategies a simple study of worldwide market tells you that there is a steady upward drift in the markets. That is why passive investment and Index based long strategies work so well. So structurally one must accept lower profit on short ideas. The other problem is you will find very few smooth waterfall moves down. While you will find many smooth multi year up moves on stocks.

So given all those constrains in my scheme of things short is a low priority trading opportunity. Unless there are no compelling longs I don't look at shorts. However I have spent significant time and effort developing some profitable short strategies. Because under certain circumstances they offer good opportunities.

The central concept behind most of my short ideas is based on the post I made some time ago - Earnings expectations and Cinderella Strategy. Essentially you must find a earning torpedo. If you find it on high growth stocks, which has been bid up a lot and is the darling of big funds, you get one smooth ride short. Such things are rare but highly profitable. Catalyst is extremely critical on short side, otherwise usual corrections are quickly bought. A mere miss on earnings may not be best short strategy. What works is if you have a sequence of earnings like say 30, 34, 45, 50, 44, 69, 40, 34. 69 , and then 7 or -20, then there is virtual scramble to get out. Because before the torpedo the stock was favorite of all growth funds

Now how does one find such stocks. One way is to follow the earnings. But there are other problems associated with shorting and that is availability. So after a considerable research and practical experience as a choice I have decided not to look at such stocks on below a certain float thresh hold. Stocks with low floats can make good shorts, but I seldom get a supply of them. So most of the time by choice I concentrate my shorting efforts on 100 million plus float stock.

Now regular readers of this blog know, I am always looking for some short cut to find such stocks. So I have found some pre existing lists which offer you good short candidates. So here are some concepts which will get you high probability shorts:
  1. IBD Mutual Fund list: On Page A9 everyday IBD publishes two lists. Largest Positions of funds in Big Cap Index and Largest positions of funds in Value Index. This list changes very slowly. Essentially a fuck up on any one of the stock in the Growth Fund list is great short. Similarly any new addition/subtraction is worth paying attention to. There are only 20 stocks in the list daily. ( This list is also useful for long ideas)
  2. Trouble after Double: This is all those stocks which have 100% or more growth in last 2 years and float above 100 million and during the move crossed price of 40. On this list I look for 4% down moves for entry. ( All stocks which during last 540 days period doubled from their 260 days low and have a float of 100 million and were priced 40 plus. Don't ask me how to do it in TC2000. You can not do it in that programme.)
  3. Episodic Pivots: Here you are again primarily looking for earnings miss or regulatory trouble.
  4. Now besides this earlier I have used another ready made list which uses a slightly more advanced concept of torpedo strategy and offers some very good opportunities- Earnings Torpedo Warning list. This list is maintained by Ross School of Business @ the University of Michigan.


As usual do your own research before trying any of these. The key is to understand the basic concept.

Next: How I make money reading a newspaper in microscopic detail
James Crammer says Watch TV get Rich. I have found a better way...........


Are you serious about your trading?

If you are serious about your trading and want to build an enduring edge the Stockbee Member site might help you. Members tell me they have tried lot of things before coming to my site and it has offered them the most extensive and detailed methods to swing and position trade.

It is only for those who want to develop their own self sufficient trading method. It is not a stock picking service. It is service for you to build your own scans and trading method to have your own daily pick based on your method.

Be warned it will take you time to learn to trade. Learning to trade is difficult art and unless you are willing to spend months or years to perfect your strategy and also develop your mental edge you are unlikely to succeed in this game. Unless you understand that no site, no service, and no mentoring is going to work.

Why traders come to stockbee?

The member site is one of the most recommended site for learning to trade by other traders and bloggers. You will see no advertising, no hard marketing, no promotions, no free offers, no affiliate marketing, no incentive to other bloggers to promote the site, no constant twits self promoting the site, no free trial  and no tall claims of making you instantly wealthy, and yet the site attracts new  members everyday. Members come from all walks of life and all kinds of trading size and trading styles.

You will see that many trading bloggers have been using my market timing methods, scans , stock ranking lists and chart templates. They have developed their own methods based on my methods. Many paid newsletter site recommend my site to their subscriber for learning about trading and market.

Over the years thousands of traders have been members and those who benefitted from the learning talk about the site to others or talk about the methods used and that is how new members learn about the site.


What will I learn in the members site?

The members site will give you in depth understanding to develop your own trading method. The emphasis is on making you self sufficient and confident of your own trading method and style.

As a member you will learn the basics of swing trading, momentum investing, growth investing and risk management.

You will learn about Stockbee Trend Intensity Breakouts method that uses momentum based swing trading to find 3 to 5 day swing trades for 8 to 40% profit.

You will learn about Stockbee Episodic Pivots Breakout method which uses Post Earnings Announcement Drift (PEAD) to find stocks that had a game changing earnings and that are likely to rally for 3 months to 12 months.

You will learn about  Stockbee Dollar Breakout method that uses momentum, range expansion and swing trading approach to find 5 to 40 dollar moves in high priced stocks.

You will learn about  Stockbee Lemonade Strategy for 401k which uses market timing and momentum to invest in 401k. You will get weekly update on how I am using the strategy on our 401k to do allocation decision.

You will learn about Stockbee Market Monitor method for market timing using breadth. It allows you to avoid risky periods in market and allows you to identify market turns. It is used for 401k allocation decisions.

You will learn about Stockbee Double Trouble method to find stock with confirmed upside momentum using anchored momentum and that are likely to continue their up move.

You will learn about Stockbee Night Time is Right Time method to find news catalyst based trade ideas for short term day trade and swing trade.

You will learn about Investor's Business Daily’s IBD 200 list and how it can be used to find swing trading candidates for explosive moves.

You will learn about Telechart 2000 and how to use it effectively to scan for swing and position trade ideas and to set up your 401k strategy.

You will learn about Jesse Livermore Range Breakout, Darvas Box setup, and many other member shared methods.

You will learn how to setup your own scans, select right kind of stocks, how to setup stops, when to enter , when to exit, how much to risk, how to track your trades and all other details about trading. You will learn about developing your own methods and not relying on others for trade ideas.

The site has hundreds of videos and trading methods and variation of methods. Members help each other in developing the methods and share actively their research and finding. A collaborative spirit allows you to get input from others on your trading ideas or problems.

The site gives you opportunity to interact with some of the most successful traders and learn from them about their trading methods. It is a vibrant community with members from different background and experience willing to help each other. The emphasis is on continuous learning and up gradation of market knowledge and setup knowledge. The members range from hedge fund employees, financial advisers, active swing traders, investors and new traders.

If you are looking to develop your own trading strategy the membership site might be for you. You have to be willing to put in the effort to build your own method. There are no silver bullets offered on members site. Every method, every scan, every nuance is detailed and all possible help is offered to design your own method.

Do you have a trial?

If you are just looking for trial you are better off trying thousands of other trading site that offer free trail or one month trial and offer you promise of riches.

It is for those who are ready beyond the trial phase and ready to put serious months or years  of efforts to learn to trade on their own. It is for those who want to learn to find their own fish.

The free blog has all the details about the methods I trade and if you go through the posts highlighted in the sidebar you will learn about them.


How can I become a member?

To sign up go to www.stockbee.biz and follow the sign up process. The site uses Paypal for payment processing.


Paternity fight over big crash

The big crash is not a bastard. There are several claiming that they predicted it. I went through my over 500 Google Readers feeds and the usual suspects plus every Tom Dick and Harry is claiming they predicted it.Some have been predicting this for their entire life. Some who were saying Greenspan call was contrary indicator to buy have quickly changed their tune to claim paternity of this crash.

The real issue is markets are not controllable. But your reaction to them is. Your trading methods are completely under your control. Market is what it is. How I react to it is important. For any given time period there is a pool of potential profit available to all market participants. Some have better method of grabbing part of that pool, some have no methods.


Now that the event has happened the big question is what is the game plan. If you think opportunities are on short side or on long side you still need a method to extract that money out of market.

As I have said before in my scheme of things conceptually I look at my trade factory having many conveyor belts. The conveyor belts bring opportunities to me, I inspect and put on trade based on risk and return parameters. Now in this trade factory there is one area for bullish conveyor belts and one for bearish. For several month the well oiled bearish conveyor belts were more or less not bringing much of opportunities. Yesterday the bearish trade factory got humming. So now bearish opportunities will present themselves.

As a speculator all I am interested in is where is the next big opportunity. If it is on bearish side I have well oiled strategies to capitalise from them. Like my long ideas all my short ideas are based on some fundamental structural concepts. Those ideas work best in bearish environment.

So there is no point in getting involved in to all the discusion of who called it right or wrong, what matters is how much you profit from the opportunity the market presents.

2/27/2007

Double Trouble

All rallies come to an end. Sometime they end dramatically, like we saw today. From July the market was in rally mode with little pullbacks or correction , so a correction is not a bad thing. If you have made money in last 8 months, the trick is to not give up much of your profit.

Now the next game plan is more important. Again the question is what will maximise profit for a given time frame. To short also you need to find right stocks to short. The stocks likely to go down the most are best shorts. Finding them is much difficult task than finding longs. Because things do not work the same way on short side. Anyone who tells you to do reverse of what you do for long for short has no idea of what he or she is talking about.

So if this correction has legs on downside, you will have opportunities to find low risk high probability opportunities. First and fundamental thing is capital protection. For long term traders better opportunities will show up in few days.

Market Monitor

Total 4% plus bullish breakouts=24
Total 4% plus bearish breakouts=1404
65 day bullish/bearish ratio= 656/281
Stocks up 50% or more in a month=8
Stocks up 25% or more in a month=65
Number of stocks with 100% plus move =294
Number of stocks up 200% or more = 69
4% plus signals for 100plus universe=2
4% plus signals for 200plus universe=1


Select stocks which had 100% plus move in last 260 days from the low and which are up more than 4% on higher volume. Today's minimum volume is above 100000. To understand how to trade this see my earlier post "How to find a stock which makes 1500% move in a year"

SGN,Signalife Inc (Google  Yahoo  Earnings  Chart
TATTF,Tat Technol Ltd (Google  Yahoo  Earnings  Chart


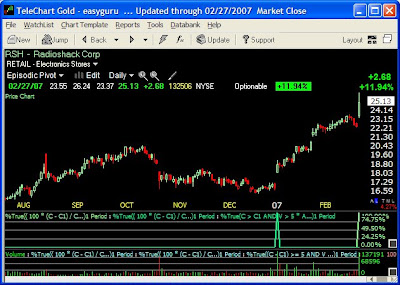
Now in the midst of this carnage Radioshack managed to make a 12% move. What was the catalyst- earnings announcement. In January it had a high volume day after raising earnings guidance , since then it has gone up about 50%.


Keep a close watch on companies announcing earnings acceleration even during this sell off. That will convince you of the power of earnings as a catalyst.

Market Panics and Niederhoffer

It is easy to lose perspective on days like today. But panics are good for markets. The most important thing to look at is what happens after the panic. Like a rubber ball the markets bounces back.


Victor Niederhoffer often quotes Henry Clews when it comes to market panic:

Henry Clews wrote in Twenty-Eight Years in Wall Street (1887):
But few gain sufficient experience in Wall Street to command success until they reach that period of life in which they have one foot in the grave. When this time comes, these old veterans of the Street usually spend long intervals of repose at their comfortable homes, and in times of panic, which recur sometimes oftener than once a year, these old fellows will be seen in Wall Street, hobbling down on their canes to their brokers’ offices.

Then they always buy good stocks to the extent of their bank balances, which they have been permitted to accumulate for just such an emergency. The panic usually rages until enough of these cash purchases of stock is made to afford a big “rake in.” When the panic has spent its force, these old fellows, who have been resting judiciously on their oars in expectation of the inevitable event, which usually returns with the regularity of the seasons, quickly realize, deposit their profits with their bankers, or the overplus thereof, after purchasing more real estate that is on the up grade, for permanent investment, and retire for another season to the quietude of their splendid homes and the bosoms of their happy families.


Few more days like today and we will be at ideal bounce scenario. So keeping the powder dry is the key.

Readers Questions

In recent days and weeks there has been a flood of new visitors, thanks to the following folks, who have linked to various posts.
http://www.chrisperruna.com/
http://highchartpatterns.blogspot.com/
http://nysetrader.blogspot.com/
http://tradewhileworking.blogspot.com/
http://tyrotrader.blogspot.com/
http://valueblogreview.blogspot.com/
http://stockdaytrading.blogspot.com/
http://www.thekirkreport.com/
http://tradermike.net/
http://greenonthescreen.blogspot.com/

There are lots of mails I am going through currently and answered most of it. If your question is still not answered you should hear by the end of the day.
Here is a quick and dirty summary of most of the things I have said in the individual mails about various issues.


Long Strategies:
All things I trade and write about revolves around three basic concepts. Earnings, momentum and neglect. Various strategies are just different versions of same ideas. It is like Coke, Classic Coke, Diet Coke, Vanilla Coke , XXX Coke, etc. versions of same basic strategies.
So if you want to trade them you need a good and deep understanding of those three concepts.
My trading time frames are medium to long durations with most trades lasting weeks to months.

Holy Grail: There is no holy grail. I am not selling any service, no software, no mentoring service and no black boxes. None of this is magical stuff. It will take at least 6 months for anyone to understand and duplicate the strategies.Lot depends on market circumstances, some things do not work under some circumstances. That does not mean the strategy is wrong.


Trading set up: I am surprised by number of questions on this. All I have is two old computers and one laptop. I use Worden brothers TC2000 for data. I also have Amibroker, which I rarely use. From TC2000 software I pull data in to my own data analysis and trading system development software and bulk of my systems operate on it.
I use Interactive Brokers.


Scans:
All scans I have mentioned so far are in TC2000. When trying to use them in other programmes be careful of volume parameters because TC uses different volume parameters.


Returns:
I do not disclose my returns, but I am profitable for last 6 years and have outperformed market by large margins. How much you will make out of these strategies depends on how you execute them, how much you understand them and above all what kind of risk management strategies you use. I get high returns because I classify my ideas as A, B, C, class ideas and risk different amounts on different ideas (A-10%, B-up to 5% and C1%). Also I vary my risk based on market phases. I also vary my risk based on how much I am up for a year. If early in the year I have high returns then I risk more on some ideas in subsequent months. That can make significant difference to your returns.

Lot of you have asked for recommended books. I will by the end of this week put together a list of 5 to 10 books or resources which might be helpful.

Weakness is good

Looks like we are gapping down. Now the action like what you see today is coming after a long and enduring rally. So it is not a bad thing. Now the usual perma bears will be dancing in the street saying we told you so. But if you want to make money, you should not be very worried. And also if you want to make money in a market with 100 years of updrift, you should any way never follow perma bears.

Most sell offs have an intense selling phase. This last few days or few weeks. The risk is highest during such periods on existing positions depending on where your entry was. The moment the intense phase gets over, slowly you will find the 100% list blossoming again. In fact you will find very good set ups after few days of weakness.

On an individual stock if there is a catalyst, barring the intense sell off phase, you would find it will still rally. The universe narrows and you might need larger stops but there are opportunities.

On the short side you will find good opportunities in the same 100% plus universe once the market turns. Later I will talk about how using the same concept of 100% plus moves in 260 days you can build a short system. It works best when market reverses after a long rally.

Later: How to find high probability shorts

Just buy the dips

The market character has undergone a change in last few days. It is a slow process and many new themes are emerging. Some old themes have for the time being run their course. In a rally of long duration, such correction zones are a bit tricky because if you remain on sideline the new emerging sector rallies you will miss out. If you short at this stage you will need good heart to hold through some nice volatility.

Some things are clearly visible. The large caps are no more the favorite. Some sectors like financials, brokers, airlines, etc. have entered correction zones after strong rallies. The small caps are back in action. More than that several new sectors are emerging as likely to take on leadership. The health care/biotech sector continues to find buy interest. But again the kind of companies leading in the sector are not the ones people are most familiar with. The Internet related sector is also attracting buying. Similarly some software companies are also in recent up trends. The commodity sector and alternative energy sector has seen the largest number of breakouts in recent 20 days. The most attractive sector currently is funeral services!!!!


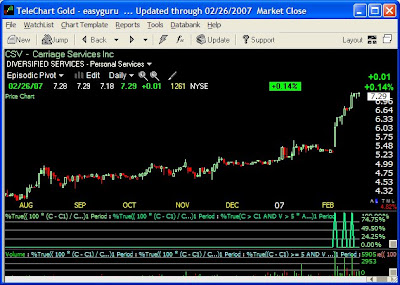
CSV a funeral services company with episodic pivots

While the sector action is interesting, it is individual stocks where most of the action is for individual traders. Upside breakouts continue to exceed downside breakouts and for almost 10-15 days the breakouts above 4% have been 100 plus. So this still looks like sector rotation and churning.

In few weeks the markets attention will shift to next earnings and some stocks will start breaking out in anticipation. One thing to watch closely is analysts future earnings estimates revisions. The ratio is moving up currently for 2007.

2/26/2007

Double Trouble

The Index weakness today was deceptive. For the first time in this rally the 100% plus universe has crossed 400 today. As I have said earlier, this number can go up to 1200 plus in healthy rally and the 200% plus number exceeds 300 by the end of rallies.
If you look at number of breakouts in the universe , it has increased sharply to 36 indicating buyers still at work. So far the market action looks like garden variety sector rotation and post earning season selling in some sectors.


Market Monitor

Total 4% plus bullish breakouts=109
Total 4% plus bearish breakouts= 66
65 day bullish/bearish ratio= 957/193
Stocks up 50% or more in a month=13
Stocks up 25% or more in a month=139
Number of stocks with 100% plus move =402
Number of stocks up 200% or more = 90
4% plus signals for 100plus universe=36
4% plus signals for 200plus universe=6

Select stocks which had 100% plus move in last 260 days from the low and which are up more than 4% on higher volume. Today's minimum volume is above 100000. To understand how to trade this see my earlier post "How to find a stock which makes 1500% move in a year"

Select breakouts from the list:

EVOL,Evolving Systems Inc (Google  Yahoo  Earnings  Chart
FTEK,Fuel Tech Inc (Google  Yahoo  Earnings  Chart
INCY,Incyte Corp (Google  Yahoo  Earnings  Chart
MFRI,Mfri Inc (Google  Yahoo  Earnings  Chart
OMRI,Omrix Biopharmaceuticals Inc (Google  Yahoo  Earnings  Chart
RIMM,Research In Motion Ltd (Google  Yahoo  Earnings  Chart
SONS,Sonus Networks Inc (Google  Yahoo  Earnings  Chart


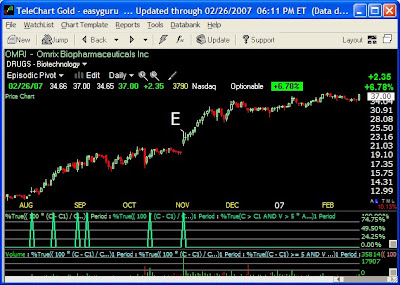
OMRI almost trippled from its first episodic pivot. The second major episodic pivot on earnings annuncement was another good entry point.

Episodic pivots on INFY

A reader asked me my opinion on INFY. Now as regular readers know the hazards of commenting on any single stock. Many times those opinion do not matter because what is important is methodology. But I sent him the following chart of INFY with episodic pivots marked on it. My studies show , further away from the episodic pivots you buy, more risky it is. In fact one of the systems I am experimenting with is to use the price move from such episodic pivots to identify possible short candidates.

Episodic Pivots on stocks up 50% plus in a month- Part3


Episodic Pivots on stocks up 50% plus in a month- Part2


Episodic Pivots on stocks up 50% plus in a month- Part1

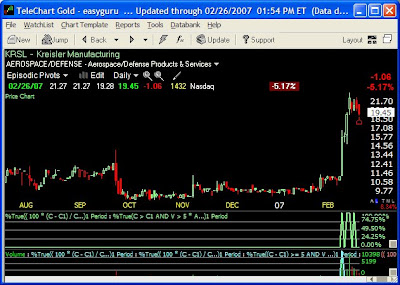
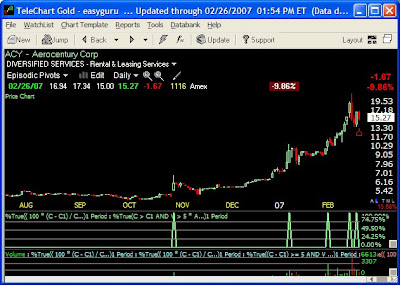
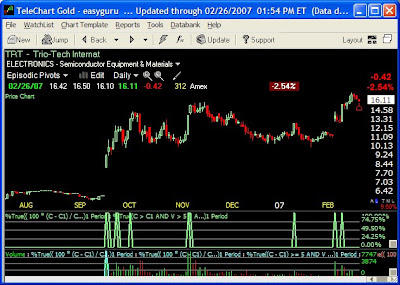
As of now there are 14 stocks in the Stocks up 50% or more in one month list. Two of them ADZA and PREM are related to mergers. So we have 12 stocks. What I did is put the markers where they appeared in episodic pivot scans. They are the green and blue spikes in last two panels.
Out of the 12 I have positions in or closed positions in 8. All of these stocks came through the Episodic Pivots scan.

ACY,Aerocentury Corp (Google  Yahoo  Earnings  Chart
ADZA,Adeza Biomedical (Google  Yahoo  Earnings  Chart
CBLI,Cleveland BioLabs Inc (Google  Yahoo  Earnings  Chart
FSLR,First Solar Inc (Google  Yahoo  Earnings  Chart
HDNG,Hardinge Inc (Google  Yahoo  Earnings  Chart
JADE,Lj Internat Inc (Google  Yahoo  Earnings  Chart
KRSL,Kreisler Manufacturing (Google  Yahoo  Earnings  Chart
NM,Navios Maritime Holdings Inc (Google  Yahoo  Earnings  Chart
ONXX,Onyx Pharmaceuticals Inc (Google  Yahoo  Earnings  Chart
PREM,Premier Community Bnkshrs (Google  Yahoo  Earnings  Chart
REFR,Research Frontiers Inc (Google  Yahoo  Earnings  Chart
TRT,Trio-Tech Internat (Google  Yahoo  Earnings  Chart
TSL,Trina Solar Ltd. (Google  Yahoo  Earnings  Chart
XIDE,Exide Tech (Google  Yahoo  Earnings  Chart


The remaining stocks in next post as blogger did not allow more pictures.

Episodic Pivots and "Idea Pickle"

Studying episodic pivots on daily basis can be profitable strategy. It is not a purely mechanical strategy. The starting point of the idea was my study to find what leads a stock to move rapidly in short time period. Or what triggers a 100% plus move in a stock in a year. Or 50% move in a month or 25% plus in a quarter.

Majority of the stock in the list had one day 10% or plus move within first 20 to 25% of their 100% or more growth in 260 days. So I framed the question as "Can a one day move signal something about future returns". Initially I tried to look at it as purely mechanical thing, but it was not very useful.There were too many stocks. So I abandoned it.

Most of the time when I abandon a concept, I put it in "Idea Pickle" jar. This is a long term practice I have used for several years, where I put half baked or promising ideas in a jar to pickle. Revisiting them after some days or months sometimes gives you a completely new idea. I have several of such "Idea Pickle" jars to ensure I never run out of ideas. Not all are related to trading , in fact most are related to new business ideas or other stuff.

Some months after I stopped working on the idea, I read a book:Swing Trading:Power Strategies to Cut Risk and Boost Profits by Jon D.Markman. There is not much useful information in that book except for one system. It describes a trading system used by George Fontanills. It is a system based on price and volume.

Now if you know Fontanills, he sells a 3000 dollar option course which basically tells you if you want to master these strategies then you need to buy another $5000 platinum course and so on. So when I read it at first I was very skeptical of it. But then I remmbered my "idea Pickle". So I investigated it further.

The system in short as per the book:

" Basically it comes down to finding stocks with greatest short term momentum that will turn in to long term momentum."
The Scans:
1 up or down 30% in a single day on at least 300000 shares traded or
2 up or down 20% in a single day on at least 1 million shares traded or
3 up or down 5$ in a single day on volume of at least one million shares and
4 still trading above $7 and
5 has options
6 has a long term catalyst like earnings or accounting fraud

He buys options on it after few days , typically such stocks after a pause tend to move up or down.

Now I played around it a bit but could not find good results. So I put the idea aside again in the "idea Pickle" jar. Last year I revisited this concept when I saw Mark Minervini site where he put up a list of his past trades. After close xamination I found that most of them were triggered by news pivots and the entries were post such high volume spikes. So that set off a bell in my head.

I revisited that Fontanills concept and my original price volume spike idea and converted it in to hybrid strategy of using a discretionary filter to eliminate some Episodic Moves.

The basic idea is to study large one day move to find stock likely to go up.

I changed the Fontanills scan a bit and added some more scans to it. So here are the scans in TC2000 for it
Bullish
1 ( 100 * (C - C1) / C1) >= 20 AND V > 10000 AND C >= 5
2 ( 100 * (C - C1) / C1) >= 30 AND V > 3000 AND C >= 5
3 (C - C1) >= 5 AND V > 10000 AND C >= 5
4 ( 100 * (C - C1) / C1) >= 10 AND V > 1000 AND C >= 5
5 C > C1 AND V > 5 * AVGV50.1 AND V > 3000 AND C > 5
These five seperate scans give the bulish pivot list
Bearish
1 ( 100 * (C - C1) / C1) <= ( - 20) AND V > 10000 AND C >= 5
2 ( 100 * (C - C1) / C1) <= ( - 30) AND V > 3000 AND C >= 5
3 (C - C1) <= ( - 5) AND V > 10000 AND C >= 5
4 ( 100 * (C - C1) / C1) <= ( - 10) AND V > 1000 AND C >= 5
These give bearish pivot candidates.

Together the scans give you less than 20 to 25 candidates to work with daily. After that I analyse each for why it is up or down to isolate the catalyst. Most of the time it is earnings, biotech news break, insider buying, major sector breakout or some news.

I enter the 1-2 with clear catalyst and where the move is just starting. Most of them I research during the day itself and enter,some next day.Many I enter later. I have also created same scans for stocks priced less than 5.

After a trial and error and building a database of such episodic pivots over some time now I have got a list of high probability events and low probability events. Earnings, new product, analyst earnings change, increased earnings guidance, sector moves etc have high probability to trigger multi month rallies.Like this I have around 12 Episodic Triggers which have high probability of starting off a 100% plus move. James Crammer, Barron's, WSJ, and other publication mentions, analyst upgrade etc. have a low probability of follow through.

After such experimentation the hybrid concept as of now has climbed to the best performing strategies amongst my pool of 20 odd strategies, beating even my earning lead breakouts strategy(which was the best strategy in my pool of strategies so far).Obviously most of the earnings lead breakouts also figure in the Episodic Pivot list.

Sometime revisiting an abandoned concept works and sometime a semi mechanical approach is better than purely mechanical approach.The Episodic Pivots approach gives you really really top quality ideas to focus on. But it is not purely mechanical.

Other Related Posts:
Episodic Pivots on stocks up 50% plus in a month- Part1
Episodic Pivots on stocks up 50% plus in a month- Part2
Episodic Pivots on stocks up 50% plus in a month- Part3
Up stocks and down stocks

2/25/2007

Finding flat bases and cups with handle

The technical analysis believers like flat bases and cup with handle. In the CANSLIM approach also there is lot of stress on chart patterns like flat bases, cup and handle and double bottom at top of the range. All these pattern essentially indicate stalled price action on the charts. It is a different and visual interpretation of the concept that long term momentum is good but to time low risk entry you should find a weakness on smaller time frame. So essentially you want to find a swing point for entry from where stock is likely to make another major move in the direction of previous major move.

If you can identify such stocks in advance then you can anticipate an entry. Some people calculate complicated pivot points on such stocks down to few cents and put conditional orders at those points. If you see the Investors Business Daily weekly 85-85 list or IBD 100 list, they have such stocks with black border.

Similarly everyday Investor Business Daily in their NYSE Stocks in the News and NASDAQ stocks in the news page have 2 stocks which are first two in that list of stocks which usually have the ideal IBD patterns and also those stocks by IBD standards are ready to breakout.

Most of the time if you read carefully it will also have exact buy points mentioned. Every day I put those 4 stocks on watchlist and you will often find those stocks breakout within few days or in most cases on the day of their appearance. Similarly notice how many of the stocks which are black boxed in 85-85 or IBD 100 breakout on Monday.

Now one of the ways to use the base universe of 100 % plus movers to find flat bases and cup with handle is to just sort those stocks with 65 day price growth and take bottom 10%. If you go through that list of stocks you will find several flat bases and cup with handle in strongly up trending stocks.

So after doing the same on the 397 stocks up more than 100% from their low in 260 days, I got this list for next week of stocks to watch:

AKAM,Akamai Technologies Inc (Google  Yahoo  Earnings  Chart
AKH,Air France KLM (Google  Yahoo  Earnings  Chart
AMAG,Advanced Magnetics Inc (Google  Yahoo  Earnings  Chart
AMIE,Ambassadors Internat Inc (Google  Yahoo  Earnings  Chart
AXTI,Axt Inc (Google  Yahoo  Earnings  Chart
BRLC,Syntax-Brillian Corp (Google  Yahoo  Earnings  Chart
CBEY,CBeyond Communications Inc (Google  Yahoo  Earnings  Chart
FCGI,First Consulting Grp Inc (Google  Yahoo  Earnings  Chart
HHGP,Hudson Highland Grp Inc W/i (Google  Yahoo  Earnings  Chart
LBY,Libbey Inc (Google  Yahoo  Earnings  Chart
LNOP,Lanoptics Ltd (Google  Yahoo  Earnings  Chart
MAG,Magnetek Inc (Google  Yahoo  Earnings  Chart
MFB,Maidenform Inc (Google  Yahoo  Earnings  Chart
OVEN,TurboChef Technologies Inc (Google  Yahoo  Earnings  Chart
POZN,Pozen Incorporated (Google  Yahoo  Earnings  Chart
RBN,Robbins & Myers Inc (Google  Yahoo  Earnings  Chart
RIMM,Research In Motion Ltd (Google  Yahoo  Earnings  Chart
RVBD,Riverbed Technologies Inc (Google  Yahoo  Earnings  Chart
SOFO,Sonic Foundry Inc (Google  Yahoo  Earnings  Chart
TAR,Telefonica De Argentina (Google  Yahoo  Earnings  Chart
TRFC,Traffic.com (Google  Yahoo  Earnings  Chart
WRSP,WorldSpace Inc (Google  Yahoo  Earnings  Chart


Now if you go through the list it is full of stocks with flat bases and cups with handle. If you further narrow down the list by earnings or any other criteria you have 4-5 good candidates to anticipate entries on. So instead of buying a breakout after a stock has gone up 4% you can anticipate a breakout and enter with a pre defined buy stop. That way you can capture a part of the breakout move.

If you want to go even further in to microscopic details, then you can find out the required volume and price action for a breakout and break it down by hours or minutes and if you see a stock meeting that condition in first one hour of trading then you buy. So that you can benefit from the 5 to 10 dollars move in a stock on day of breakout. This can further reduce your risk on entry by reducing the distance from breakout price. That is how the list on first page of Investors.com is generated under the heading Stocks On The Move. The list is calculated by using hourly equivalent of the the percentage up or down in trading volume of a stock compared to its average daily volume over the past 50 days.(The average 50 day figure is divided by number of trading hours and given a certain weight for first few hours and when the trading volume exceeds that level, the stock appears on that list).

Another very microscopic detail which can help you fine tune your entries.