12/27/2016

A sideways action after a big bounce


Markets have settled in to sideways action after a big bounce. The extremely bullish breadth readings few weeks ago pointed to this.

 Many stocks that made a big move in the bounce are going sideways and setting up for next up leg.  In the short run the sideways move might continue for few weeks.

12/12/2016

Extremely Bullish readings on breadth


We are looking at some of the most extreme bullish reading on breadth in last few years. It shows the powerful buying surge post Trump election.

In short run a consolidation/pullback more likely as market digests this surge. After a orderly correction more upside likely for next couple of quarters. 

12/05/2016

It can bounce but it can not sustain


sA.png

For last 2 year the market has had 4 big bounces after a correction but each of the three times the market just went sideways after that.

This tendency has persisted since 2014. Will it be different this time?

This inability to build on bounce results i n just one leg rallies in many stocks on both bullish and bearish side.


11/29/2016

A bit of pullback


Markets reacted extremely positively to Trump election. As you can see it resulted in huge asset allocation back in to stocks and breadth jumped from negative to positive.

Rallies seldom go straight up. Once breadth becomes extremely positive there tends to be pullback or consolidation. We are at that stage,.

If the rally has further upside then the pullback/consolidation will be orderly and will be aggressively bought.

11/09/2016

Situational Awareness


Based on breadth trends market is in downtrend for few weeks.  
There was a bounce in last 2 days.Overnight futures are down.
Personally I will see how the market acts in next 48 hours before making any big commitment.
So far in last 7 to 8 years markets have recovered from such selling.
I will watch for breadth thrust to signal change in buying or selling.

10/31/2016

Tricky period for breakouts

The breadth has steadily deteriorated in last one month. Currently the Stockbee  Market Monitor is in negative territory.


The stocks leading the advance since brexit bottom are showing signs of breakdiowns. The breakouts do not have enough follow through.

But as of now the market overall is down only around 2.5% and looks to be in sideways range.


The election results might be the catalyst that will clarify market direction and launch year end rally.

10/27/2016

How to profit from PEAD (Post Earnings Announcement Drift)

Currently we are in earnings season. During the earnings season there are always some stocks that have significant earnings surprise either to upside or downside. Such earnings surprises lead to rallies in such stocks. Those rallies are not just one day wonders. If the earnings was game changer them that stock can continue to rally for next quarter or more.

This tendency of stocks to move in direction of earnings surprise is called PEADS. 

PEAD (Post Earnings Announcement Drift) is a very well known and extensively studied market anomaly. Ball and Brown first documented the PEAD phenomenon in 1968. Since then hundreds of thousand studies have confirmed their findings across world markets. Stocks that beat earnings substantially and exceed analyst expectations outperform over period.

Everyday during earnings season number of companies surpass earnings expectations or miss earnings. When earnings is announced it is compared to existing expectations.

If the earnings is a major surprise to the market then the stocks reacts immediately to that news. Most of the time the stock with significant earnings surprise  will make 40 to 100% move on earnings day itself if it is a small cap with low float. Depending on market conditions these stocks can go in to multi week rally. In uncertain market conditions, they tend to pullback and go sideways or form range and then breakout nearer to next earnings.

When looking for PEAD candidates , stocks with first or second significant earnings surprises and significant earnings growth lead to big moves. After a few quarters of earnings acceleration, everyone notices it and the reaction is more muted as the earnings get discounted. Very few stocks can consistently surprise on upside for more than few quarters. 


There is a cockroach effect in earnings trends. One earnings surprise is typically followed by many more earnings surprises. When you focus on first earnings acceleration there is good chance your stock will have more such earnings. So effort spent in researching stocks during earnings season can pay you off for many quarters. The structural factors which contribute to earnings acceleration do not disappear in one quarter. That is why earnings trends persist and price trends persist.

If you want to profit from earnings track the significant surprises this season.

10/20/2016

Develop these habits to improve your trading


image

Daily study past winners and losers on various time frames and note down your observations.
If you can develop this habit you will see steady improvement in your understanding of market moves and it will be based on your own efforts.

What should you study for short term swing trading

Study stocks up 8% plus in last 5 days c/c5>=1.08 and c>=3 and minv3.1>=100000
Study stocks down 8% plus in last 5 days c/c5<=.92 and c>=3 and minv3.1>=100000
Study stocks up 5 dollar plus in last five days c-c5>=5 and c>=3 and minv3.1>=100000
Study stocks down 5 dollar plus in last five days c5-c>=5 and c>=3 and minv3.1>=100000
Those are the kind of stock moves that swing traders are interested in. By studying them daily you will understand what works and what to look for in momentum burst swing moves. Where to put stop. Where to exit. What to look for on day one of move.
If you do this for weeks and months or years you will be expert in 8% plus moves. When you study these moves over and over again you start finding small nuances to look for in successful breakouts.
A study like this will make you question some of your own guidelines for selecting trades or will make you question commonly touted market rules based on your own study.
One of the best reason for doing this is it is based on actual past winners in immediate time frame. It gives you lot of information on what is working currently.
Most days it takes only 10 to 15 minutes to do this. Some days while going through them you find something and then it can trigger a deeper study.

What should you study for longer term swing trading

Study stocks up 100% plus in last 1 year c/c252>=2 and c>=3 and minv3.1>=100000
Study stocks down 50% plus in last 1 year c/c252<=.5 and c>=3 and minv3.1>=100000
Study stocks ranked in top 25 by MDT ranking c/avgc126 rank by it and study top 25 or 100
Study stocks ranked in bottom 25 by MDT ranking c/avgc126 rank and study bottom 25
Study stocks ranked in top and bottom 25 by YTD moves
Longer term moves have different characteristics and studying them will help you find buy points as the move progresses.
A study like this will also help you debunk lot of myths like should you only buy stocks near 52 week low or high, with only low floats, or only with IBD EPS ratings above 85 , or with growth or value characteristics, or IPO in last 2 or 3 years only and so on and on.
Get in to habit of building your own market and setup. No one else can do these exercises for you.
image
As everyone knows if you want gains of an exercise you need to do it yourself and not outsource it to others.

10/19/2016

Bullish and bearish anticipation setup for today

Bullish Anticipation

CGNX WGO PAYC WIX STB FB CTRL GNW

Bearish Anticipation

CBRL DXCM PII DECK LEG LGIH SCSS

10/17/2016

Breadth deterioration continues

The markets  are experiencing steady decline in breadth . Sellers are dominating the action in last few weeks.

MM.png

This kind of selling is not conducive to breakout buying. A breadth thrust to bullish side can reverse this deterioration.

In spite of selling the Indexes are near high and continue to go sideways.

spy.png

Periods like these can lead to death by thousand cuts if you are too aggressive on long side. Protecting capital and being selective is the key at this stage.

10/12/2016

Steady breadth deterioration

In recent month there has been a steady breadth deterioration. You can see that in Market Monitor.

MM.png

In last 13 days we have seen 7 negative breadth days. On 9/9/2016 we had a big 634  down day . That selling has not been followed by aggressive buying.

The T2108 Worden indicator peaked at 79.73% on 7/18/2016. Current it is at 35.37 which tells you only 1/3rd of the stock universe is above its 40 day moving average  or in other words in uptrend.

This selling has been slow and not affected the indexes so much as they have been going sideways for months after an initial sharp bounce in July. The sideways action is also showing up in many stocks. If you see the anticipation scan , you will see several examples of that.


sp.png

Breadth divergence and deterioration by itself is not fatal unless we get big selling and setup failures. As of now we do not see much of that.

10/11/2016

Sideways range is leading to less follow through on breakouts

image

A sideways range has formed from middle of July.
In recent days a up day is followed by down day.
As a result of index action compression vigorous follow through on most b/o is lacking .
Need to be selective in buying b/o

10/06/2016

How to use momentum to find swing trades

Swing trading s a style of trading in which speculators profit by capturing part of a explosive move with low risk. It is active trading style that looks for several hundred trades a year.

There are many different ways to swing trade that I know of , but I focus on primarily swing trading stocks with established momentum.

When a stock has momentum it exhibits certain tendencies and if you study those tendencies you can profit from them.

ATHM is recent example of swing trade on a stock that had just started a momentum phase as defined by my momentum indicator Stockbee Trend Intensity.

Everyday I scan for stocks with Stockbee Trend Intensity above 1.05. ATHM showed up in these scans for first time on September 26th. On September 30th , it showed up in my Anticipation Scan as it had consolidated for 7 days after establishing momentum. On October 3rd it had a  breakout and as I had it in my watch list I saw it early.


In these kind of swing trades the stop I use is low of the entry day which was 24.37. The stock had follow through next day and was up 6.93%. I closed part of the position to lock in quick profits. Third day it was up more till 10:30 AM before fading the gains. But by then I had exited the trade at 27.87. I always like selling in to strength. the stock did move a bit more after that before fading the gains. But by then the trade was over for me.


If you see this stock, it made 16% move in 3 days before fading yesterday. That is the kind of momentum burst which show up regularly on momentum stocks. 

The key to trading  these kind of move is to understand the nature of these moves. These moves are just 3 to 5 days move. So I am looking for exit on 3rd day if trade has already made 8 to 20% by then. Exiting in to strength is best in these kind of trades. 

How can you find these kind of trades?

The entire process to identify and trade these kind of moves has been detailed on this blog multiple times. If you study the posts highlighted in the sidebar you will see detailed guidelines to scan for these setups.

If you are serious making money swing trading, invest in a software, setup scans, find stocks with momentum , develop process to trade them. If you can do that you do not need  stock picks from others. 

10/05/2016

How to find explosive moves in stocks

Short term momentum swings in stocks are driven by supply demand imbalances. Periods of high demand or supply are followed by periods of low demand or supply. This creates momentum bursts in stocks moves.

bvx.png

A stock after going up pauses briefly, but any small catalyst can lead it to breakout of the range, this is noticed by market participants and then they enter in the hope of capturing the next part of the swing.

BVX is current example of this  kind of stock. It has gone up in 3 swings in last 3 months. The first swing was followed by minor 6 day pullback. The second swing was followed by 24 days sideways consolidation.

bvx1.png

The underlying cause for stock momentum can be fundamental driven, news driven, sector driven, or often  sentiment driven. But no matter the cause basic tendency of stock is to move in momentum bursts of 3 to 10 days . These bursts are of 8% to 50% magnitude.

bvx1.png
Once you understand this structural phenomenon of momentum bursts you can exploit it to capture short term swings of 3 to 10 days. Those swings offer 8% to 50% profit opportunities in short period of time. 


bvx.png


When swing trading these kind of moves it is critical to take profits into strength. Such momentum burst swings typically last for 3 to 10 days. If you overstay the trade then you can end of giving up bulk of the profit. 

If you want to profit from these kind of momentum burst, first start by studying such past moves a nd understand them. These kind of moves happen everyday.

9/26/2016

Stocks likely to make 8% to 20% move


MOMO GNW NRP DAKT SNMX RIGL WB ATEN STKL NTAP XIN OCUL CHGG GNCA CVGI SE KZ URBN BPOP GPRE CECE UAL VRA EZPW BAC TCB CY SNV CMA STI QTWO

9/23/2016

Bullish Anticipation Setups for today


HTHT
CECE
JD
OCN
MS
ACTG
MOMO
VMW
GNW
MMSI
IBKC
Q
BETR
IMS
NRP
CY
KZ
QTWO
BAC
DAKT
NMIH
CVGI
EZPW

9/20/2016

How I scan for swing trade ideas

I use Telechart Gold (with real time Data) for all my scans. In Telechart scans are called PCF (personal criteria formula). Easyscans is another Telechart terminology used for creating scans.

PCF stands for Personal Criteria Formula for Telechart Software. It is a formula that you write to add a new sort criterion to the program.. PCFs written in Telechart searches for various Patterns/conditions described by the formula(s)


pcf.png

4% breakout


This is a very simple 15 year old scan idea that  has made me few million dollar profit over the years. It is used daily.


4.png
Bullish  

c/c1>=1.04 and v>v1 and v>=100000

If you want to reduce low priced candidates add a filter of c>3


Bearish

c/c1<=.96 and v>v1 and v>=100000

If you want to reduce low priced candidates add a filter of c>3


$ breakout

As my acount size has increased significantly over the years I rely more on this scan to find swing trade candidates.
dollar.png
This scan is good for high priced stocks. It helps you find both intraday setups and swing trade setups.

Bullish

c-o>=.90 and v>=100000
you can add a filter c1<c2 to reduce number of candidates but it can also eliminate sock with low range positive day so I do not use  that.

Bearish
o-c>=.90 and v>=100000
you can add a filter c1>c2 to reduce number of candidates but it can also eliminate sock with low range negative  day so I do not use  that.

Bullish and bearish combo

c-o>=.90 or o-c>=.90 and v>=100000

Bullish and bearish combo with price filter

c-o>=.90 or o-c>=.90 and v>=100000 and c>=30


Episodic Pivots (EP)

Episodic Pivots Strategy has been one of the most profitable strategy over the years and is used to find position trades. It gives very few good ideas in a year.

Episodic Pivots are major breakouts that can lead to multi month or multi year rallies. They are triggered by some news events. The scan only gives you candidates for further study. You can find more details about this strategy on this site in sidebars.

c/c1>1.04 and v>3*avgv50.1 and v>=300000


EP.png


These scans are used daily to find swing trade candidates during the day. For finding anticipation candidates I use a different set of scans after the market close.


9/19/2016

How to organize yourself for trading everyday

Organize yourself for trading everyday

Everyday do the same thing over and over in a systematic manner.
Once you have a well thought out method the day to day challenge is largely about implementing your plan.
That requires setting up a daily routine and adhering to it as far as possible.

Situational Awareness

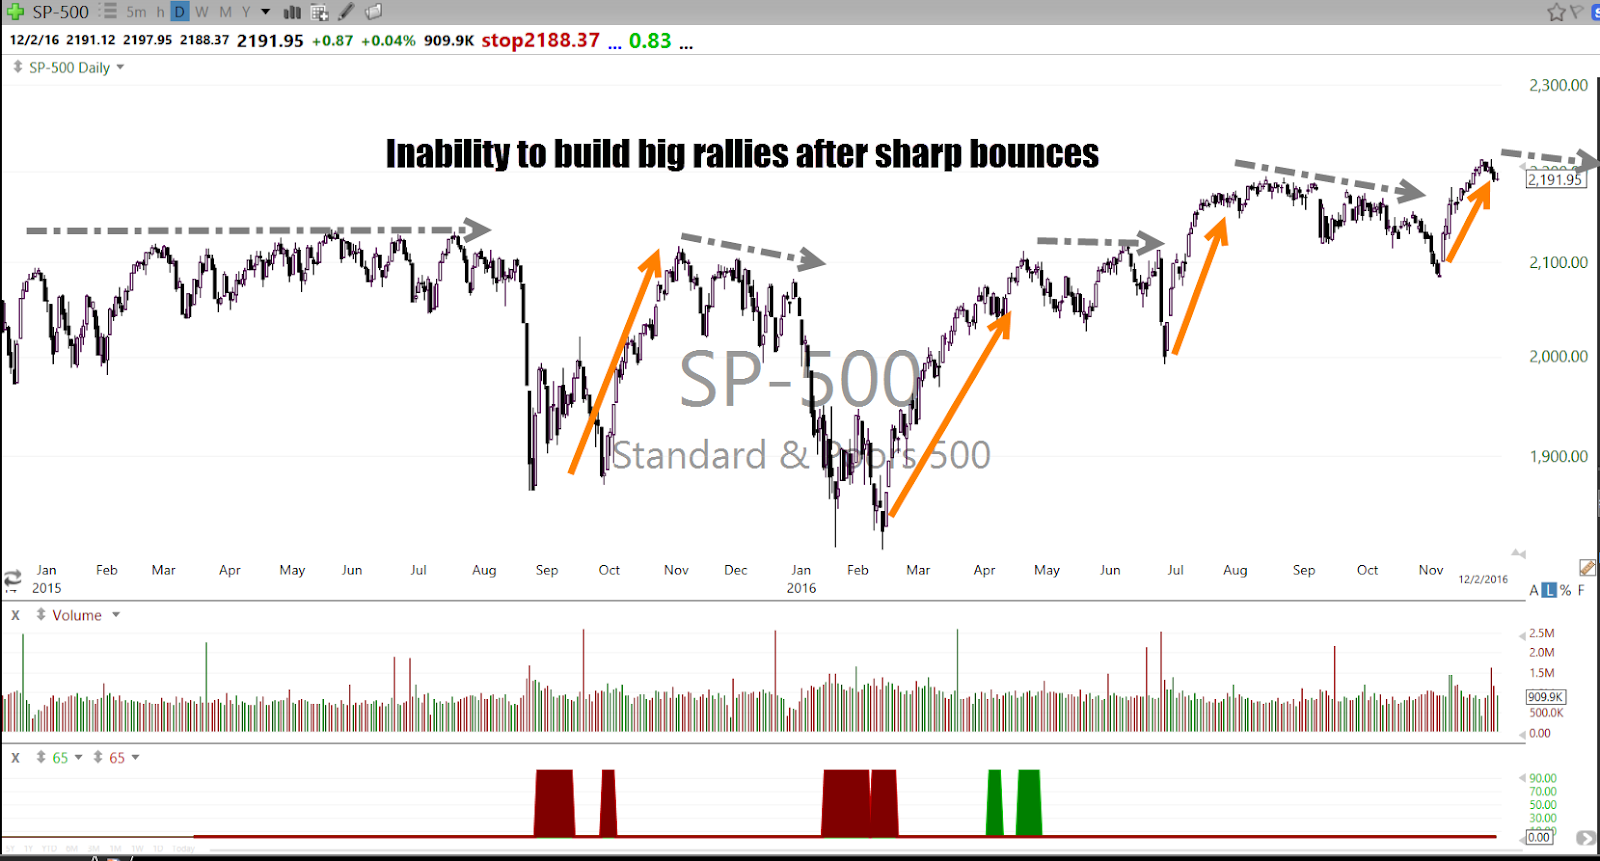
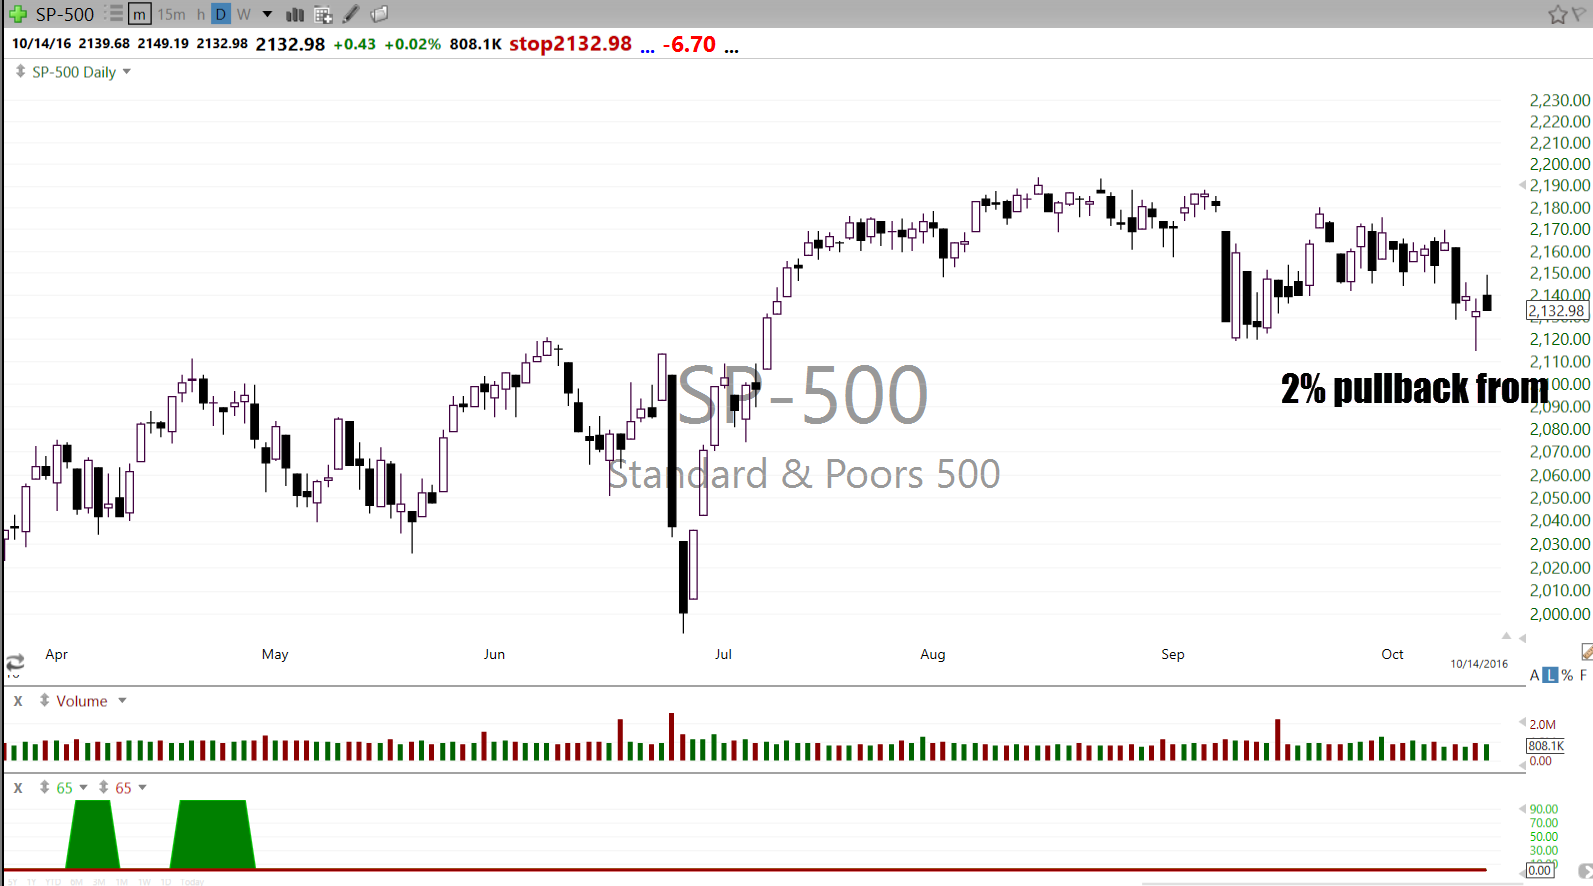
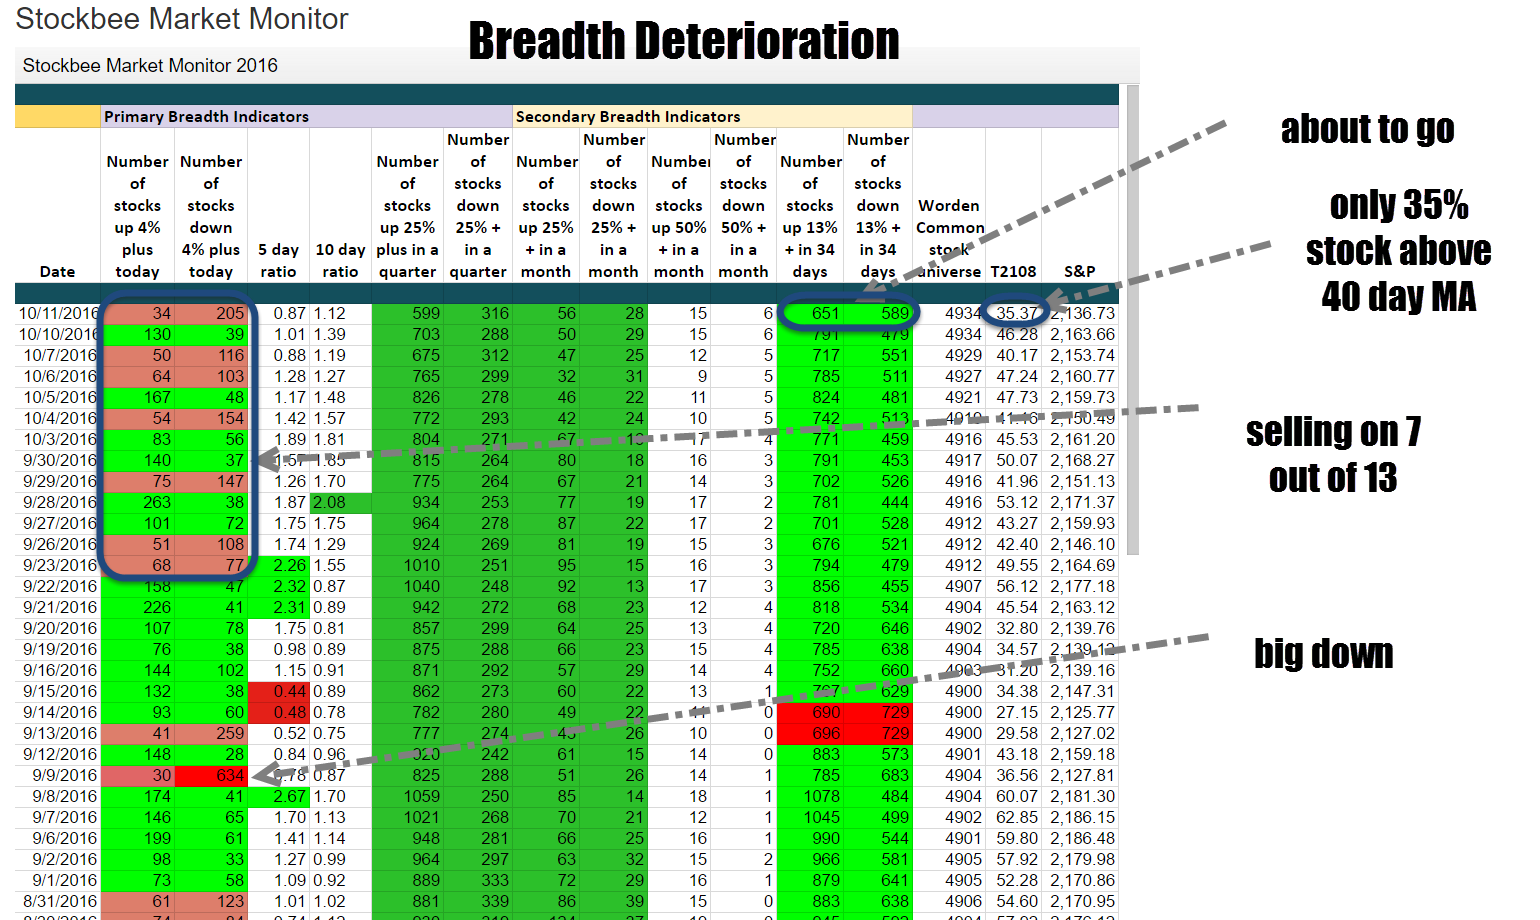
We know swing setups work, but overall market conditions can have impact on the % of trades likely to work. So SA helps you in controlling your trade pace. In good environment you want to be more aggressive. In bad conditions you want to focus on risk management.
Question you need to ask daily for SA:
What is your market bias today
Is there a plan to exploit it
Is there an alternative plan

Anticipation

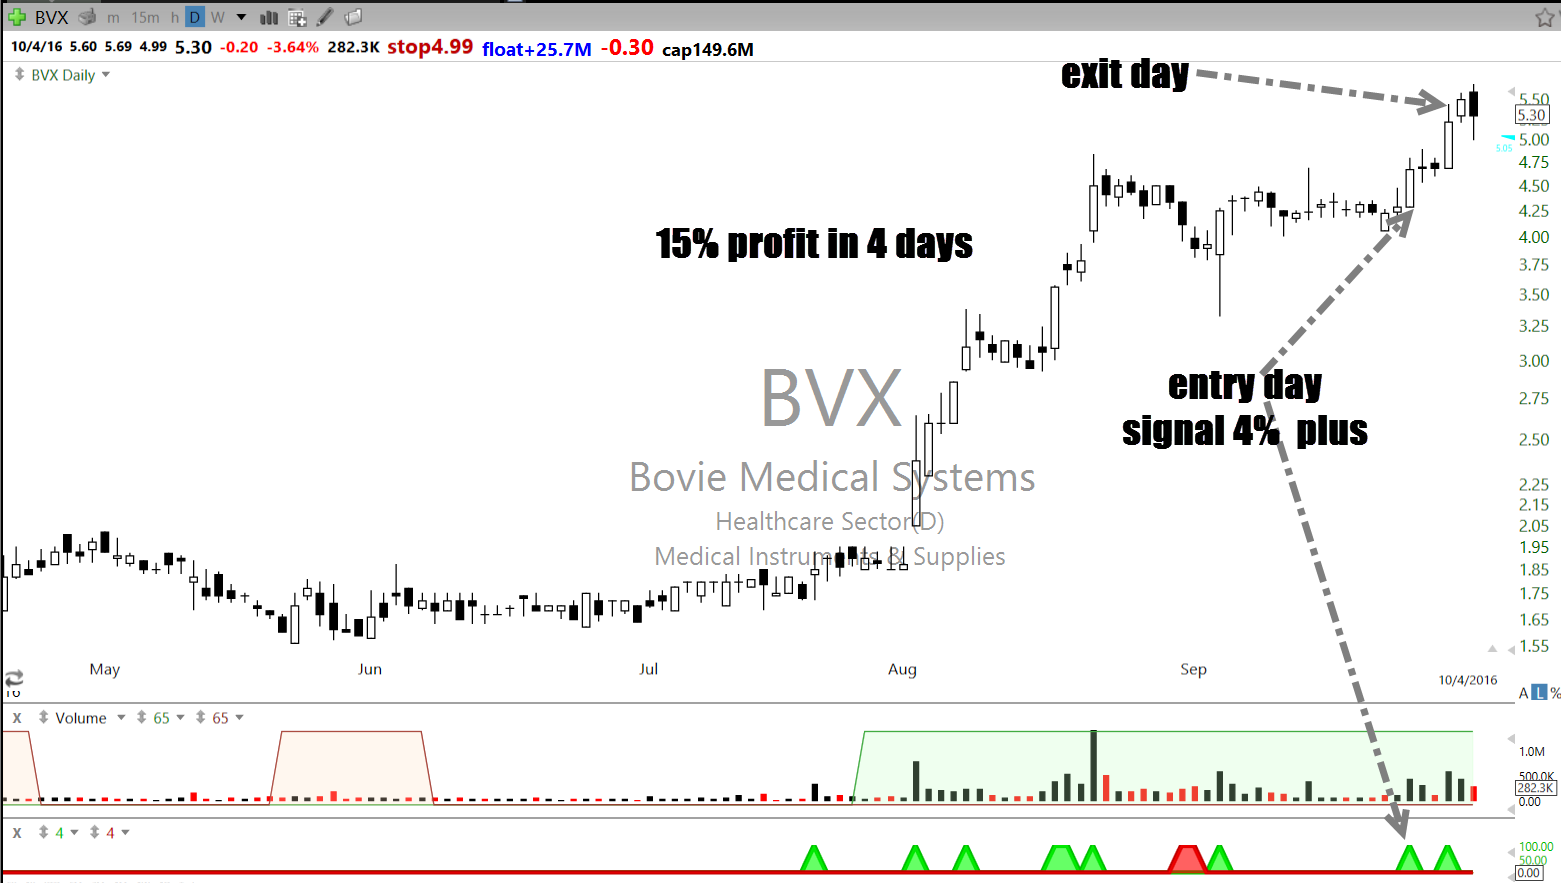
Anticipation allows you to control risk and get in to setups early or as they are breaking out. Anticipation is also useful on current open positions. If you have thought through what you will do under different circumstances on your open positions you are in better position.
Question you need to ask daily for Anticipation:
What homework have I done to identify good opportunities ?
What are the 3 to 5 very high probability opportunities I must focus on today
What is my plan for existing open positions

What is working currently

Different phases of market favor different kind of stocks or setups. Some time beaten down stocks do well. Sometime stocks with momentum do well. Some time value or growth is in favor. Knowing what is working helps you focus on hot opportunities.
Question you need to ask daily for What is working:
What is working in the market currently
What stocks and sectors are leading the market currently
What style and setups are working currently
What kind of follow through is happening

The hardware and software

All our good plans or intentions or setups are of no use if our hardware or software fails or is not optimum for trading.
Are you setup for today
Is your hardware in proper condition
Is your software working without glitch
What is your backup plan in case of failure.

Your mental state

Your mental state affects your trading. If your are well organised and in proper frame of mind for trading you will be successful. If you are excited, harried, angry, disorganized you will find same thing in your trading.
Are you calm, excited, harried , or confused today?
Are there distractions likely to affect your trading today?

Continuous improvement

As a trader you need to focus at least 25% of your daily efforts on developing new trading setups and ideas and on enhancing your trading skill and knowledge of market. A purposeful plan to do this will cumulatively help you transitions in to new setups and ideas as market changes.
What is your plan for enhancing your market knowledge today
What is your plan for enhancing your trading skills
What is your plan for enhancing your trading mindset

What needs to happen for me to be a confident and in control trader

Do I have resources to get there?
Do I have the burning drive to get there?
Everyday using this kind of framework will make you a better trader . If you rigorously follow these kind of checklist you will see improvements in your trading in 90 days.

9/15/2016

How to use momentum to swing trade


When swing trading stocks with momentum the lowest risk entry is on first valid swing trading setup after momentum is established.

ren.png
REN above is an example of a anticipation setup that is more risky as of now.

In order to find momentum in above example of REN we are using Stockbee Trend Intensity Indicator TI 65 ( which gives you momentum for a quarter). The green zone indicates TI65 values above 1.05 and that confirms stocks has established above average momentum or is in Intensely trending period.

Once TI 65 is above 1.05 the first or second swing trading setup that develops due to pullback or sideways consolidation is the ideal buy setup. It is a trend continuation setup. In case of REN that successful setup was on August 4th. Earlier breakout on July 22 failed to follow through.

As you can see in the chart below that day it appeared in STIB ( Stockbee trend intensity breakout scan ) signalling swing entry. In next 14 days stock went up 162%. Subsequent breakout had much smaller 30% follow through.
ren1.png

Now it is again setting up , but now it is a risky setup as the trend has progressed for many days and chances of reversal or range bound action are more.

If you want to hold stocks for longer term swing moves then getting in to momentum stock early is key. Early entry allows you to hold it for longer duration as against 3 to 5 day hold for normal swing.

As momentum phase progresses stock can setup multiple times and offer swing trade opportunities , but risk increases as trend matures.

If you are looking for longer duration position swing trades or trend tardes  then focus on “Young momentum Candidates”

Look for stocks that have just entered momentum phase and are now having their first consolidation or pullback.

Here are some of the“Young momentum Candidates” setting up for possible breakouts:

anw.png

dakt.png

ocn.png

pahc.png

If you want to make money swing trading focus on “Young momentum Candidates”

9/14/2016

Bullish Anticipation setups for today


CFNL
OEC
CHGG
BLOX
NBHC
MB
OCN
HDSN
OXLC
NR
CECE
CVGI
TCBI
NGVT
WCG

To find stocks like this  study the post  that details how to find them: 

How to find anticipation candidates

9/12/2016

Stockbee 50: New entrants 09/12/2016

The Stockbee 50 is a list of fastest moving stocks in the market. These are stocks with above average momentum.

Stocks with good momentum keep going up. If you are serious about making money, it is a good idea to keep an eye on the stocks in the Stockbee 50 list.
Momentum ranking is relative and so stocks that gain momentum move up the rank and those that lose momentum drop off.
There 18 new entries in the Stockbee 50 list this week. The new entries at some point will setup again. Once they are ready, they can be entered as an anticipation trade or as a breakout trade.
There are 23 that dropped from the list this week. It is also a good idea to keep an eye on these as well as they might set-up again for a second leg up.
List of New Entrants:
CLCD UAMY NAVB CYNA CPHD APIC SORL ACW CHK AAOI NVLS VNRX NAV TIVO SBLK NVFY FSI BCEI
List of stocks dropping rank
ROKA SQNM TLYS AEPI AQXP OCLR FELP SINA HDSN SPAR KURA CSTM GSV BCOV HLIT DXPE EZPW AMD WATT FSAM AMBR KPTI LEE
From the list that has dropped ranking
TLYS FELP
is looking good. Both might need to go sideways for few more days before breaking out.

9/08/2016

Stocks move in the direction of the range expansion


Stocks move in the direction of range expansion. This is the basic tendency of stock market. 

HWAY above is a recent example of that. Stock had not had a positive range expansion for few months. A range expansion in 

If a stock has not had a range expansion of certain magnitude for a considerable period of time and then suddenly has a range expansion, it is a signal that stock is likely to  move in the direction of the range expansion. 

BID is another example of same phenomenon.


In July BID had a range expansion to the bullish side and from that it moved in the direction of range expansion.

If you want to make millions trading then study this phenomenon in the market and exploit it. All successful setups in market are developed from such basic underlying market observations over thousands of stocks.

Once you understand this tendency of stocks , all that you need to do is develop your setup and process and wait for next good setup to show up.

BCRX shown below is an example of that kind of setup showing up yesterday along with bunch of others. Last time it had range expansion it made 50% plus move in few days.


If you are really serious about  making money  trading stocks , master swing trading setups like these. 

9/07/2016

Bullish Anticipation Setups for today

MTZ ELLI BID AMKR EXAR UNT DVN ZLTQ CVLT VIAV GLW HPQ NCI HRG INST HTGC AWH SREV CERN RACE TRN

9/06/2016

Stockbee 50: New entrants 09/06/2016


The Stockbee 50 is a list of fastest moving stocks in the market. These are stocks with above average momentum.

Stocks with good momentum keep going up. If you are serious about making money, it is a good idea to keep an eye on the stocks in the Stockbee 50 list.
Momentum ranking is relative and so stocks that gain momentum move up the rank and those that lose momentum drop off.
There 27 new entries in the Stockbee 50 list this week. The new entries at some point will setup again. Once they are ready, they can be entered as an anticipation trade or as a breakout trade.
There are 25 that dropped from the list this week. It is also a good idea to keep an eye on these as well as they might set-up again for a second leg up.
List of New Entrants:
PSG PI HLIT SKLN LEE SPU CRNT MSTX ABEO SINA FELP OCLR EMES CSTM BREW CRK TLYS PQ AEPI FSAM KURA AQXP NTP ROKA KPTI MPET RJETQ
List of stocks dropping rank
ENRJ CPRX SPHS ATRS SNMX NYMX KRO GNW VNDA DAKT CVGI MX SNSS AOSL KTOS CSII ANW ELMD EVH LPTN CLNE PCMI AMDA IPDN ETAK
From the list that has dropped ranking
ANW
is looking good. KRO and DAKT might need to go sideways for few more days on low volume before breaking out.

How to find stocks setting up for breakouts


To anticipate a breakout look at stocks currently not undergoing momentum burst.

Stock should be in extremely low momentum phase for anticipation .
It can be a shallow pullback or consolidation in established momentum phase.

To anticipate look for stock with extremely low volatility

A stock with low volatility in last 5 to 10 days is ideal candidate as part of a continuation setup.
Look for series of low range bars in last 5 to 10 days
Look for stocks with bollinger band squeeze.

Avoid Anticipation setups on extended stocks

First or second anticipation setup in established trend is best
Extended trends needs to be avoided for anticipation as failure is high on them

Look for early entry on anticipation candidates

Anticipating a breakout helps you get an early entry and can improve your per trade profits.
It also can lower your risk as your stop is closer.
It can help you profit from even smaller moves.
For that entry without waiting for breakout is best.

Anticipation requires more pre planning and effort than buying a breakout.

You need a process flow to do that.
The process should be efficient and done daily after the market close.
The suggested process flow is a template you can develop your own process.

Only 3 to 5 quality ideas should be tracked

"A" grade pre Momentum Burst setup should be your first priority
Once you have list of anticipation setups narrow them down to 1 to 5 for next day action.
Quality is more important than quantity

In order to find Bullish Anticipation setup use DT and TI 65 lists in Telechart

Double Trouble Scan

US common stocks
c/minl252>=1.8 and minv3.1>=100000
Price % change Today between 1 to -1%

TI65

US Common stocks
avgc7/avgc65>1.05 and minv3.1>100000
Price % change Today between 1 to -1%

MDT Above 1.19

US Common stocks
c/avgc126>1.19 and minv3.1>100000
Price % change Today between 1 to -1%

After running these three scan merge them together as some stocks will be common.

Go through the list to find setups that are setting up for possible b/o

What to look for in good anticipation setup

series of narrow range days in pullback/consolidation
orderly pullback with no 4% b/d during the pullback or consolidation
low volume pullback
low volatility during pullback
linear first leg if looking as continuation setup
Stock should go up smoothly and not in volatile manner
3 to 10 days consolidation/pullback
not up 3 days in a row
This entire process once setup tales just 20 minutes daily. You can find 5 to 10 good set ups using this process daily. In good market conditions these setups can make 8 to 20% in just few days. So if you are serious about making money swing trading setup these scans and practice finding good setups. 
Anticipation Watchlist 
these are stocks i am watching for possible breakouts.
OPTT INST DXPE FLXN BWLD INGN ARDX NVRO PETS TBPH RTK OLLI LOCO TNET AIMT VAC PGND FDP ACIA YRCW VSAT SQ ITCI ISRG TWOU ANW BDC NSM ERII ZLTQ IPHI UIS DNB FCN SPNC ABCO ZBRA BID SALE CVLT SCSS OFG UNT PCLN BHE PODD SMG AWI KLXI NCI NUS SUPN SREV TPX EME CTB MIDD MHK ENLC PES MTZ YELP XPO FFIV MBFI STAR AZPN IRWD HTH LLL IFF WMGI CGNX PVH DXCM ECR DKS AWH URI LSCC LPI EXAS VAR EXTR AMKR MBI HRG RACE ENTG TPH PH CNX SWK FBHS PGRE TRGP CMI ARIA NTAP SWKS JBL HUN CIT QGEN EW BDX QEP HOLX BBY TRMB GRPN NAVI YNDX GNTX MXIM CERN ADI PAYX SLM MAS UAL NXPI YUM KKR MPC AAL MMM TWX UNP TXN CSX GLW AIG BSX QCOM HPQ FB MSFT JD BEL CX BSBR ERF NGVT