4/30/2007

Market Monitor

The story remains same with large caps dominating the action. Small caps have not participated so far. The IBD kind of stocks are underperforming.

Market Monitor


Total 4% plus bullish breakouts = 125

Total 4% plus bearish breakouts = 80

65 day bullish/bearish ratio = 973/269

Stocks up 50% or more in a month = 11

Stocks up 25% or more in a month = 95

Number of stocks with 100% plus move = 431

Number of stocks up 200% or more = 94

4% plus signals for 100plus universe = 29

4% plus signals for 200plus universe = 8


Double Trouble breakouts
AMIE,Ambassadors Internat Inc (Google  Yahoo  Earnings  Chart
CPY,Cpi Corp (Google  Yahoo  Earnings  Chart
GCOM,Globecomm Systems Inc (Google  Yahoo  Earnings  Chart
GRIL,Grill Concepts Inc (Google  Yahoo  Earnings  Chart
GSOL,Global Sources Ltd. (Google  Yahoo  Earnings  Chart
IDMI,IDM Pharma Inc (Google  Yahoo  Earnings  Chart
MA,MasterCard Inc (Google  Yahoo  Earnings  Chart
NYMX,Nymox Pharmaceutical Corp (Google  Yahoo  Earnings  Chart
ONNN,On Semiconductor Corp (Google  Yahoo  Earnings  Chart
RPRX,Repros Therapeutics Inc (Google  Yahoo  Earnings  Chart
SNCR,Synchronoss Technologies Inc (Google  Yahoo  Earnings  Chart

4/29/2007

Mental models and orbital changes

I have got number of emails about my previous posts about mental models, asking for details.

Much of my interest in mental modeling started when I spent 6 years in advertising industry. Advertising industry is possibly the largest and the most shrewed user of every psychological technique known to mankind. All successful persuasion involves either reinforcing or challenging existing mental models.

One of the first research I was involved with was on cigarettes, for the launch of a new cigarette. Now cigarette as a product is conspicuous consumption product. What you smoke tells a lot about what you are as a person or what you want to project to the world. When we researched cigarette buyers, they had different mental models and their brand choices were determined by their mental models.

So in focus groups people would explain their brand choice by their life philosophy, beliefs, assumptions, images, etc. You could clearly see people with different mental models had different career choices, different earnings capabilities, different levels of success in life. All their choices and behavior flowed form those mental models. One of the very popular brand of cigarette in India at that time was Red and White. It was primarily targeted at lower middle class. It had a very popular advertisement running at that time in Hindi, "Red and White pine walo ki baat hi kuch alag hain"( There is something special about a Red and White smoker). People in focus groups or in interviews would sum up their life philosophy by using that line.

One of the task we were assigned was to identify different mental models and I spent considerable time going through various studies in mental modeling and coming out with hypothetical mental models and testing them with actual people. So I got deeply involved in to researching mental models. The central role of effective advertising is to change or reinforce consumers existing mental models through communication.

Subsequently I spent 6-7 years in service industry where again the quality of service at individual level is a function of front line workers mental models. So service industries create an idealized profile of excellent service worker and recruit people with similar mental models ( in USA this is bit tricky because this is called profiling). Internally service companies create a organizational culture which encourages and actively recruits people with certain mental models and punishes or do not hire people with different mental model. I did lot of work in creating such "profiles" of mental model when I worked in service industry, as that is the key to good service quality where personal interaction is involved.

While doing this I was teaching MBA courses as a guest lecturer. I did this for many years and interacted with lot of young people and started studying their mental models in order to shape and change them. I also spent some time formally researching and interviewing people who were successful in managerial roles in senior management roles or in other fields like journalism, sports, academics, etc. Much of my understanding of mental modeling has evolved out of those studies and experience.

Mental models are deeply held mental images, beliefs, and assumptions. The mental models play a very important role in dealing with world around us. We interpret the world according to our mental models. Two people with different mental models react and interpret same data and same situations differently. Mental models include what a person thinks is true but not necessarily what is actually true.

What I observed is that successful people had very different mental models. They did, not just few things differently, but they did 100 things differently. Their world view and assumption about world and people was very different from those who were not very successful. One of the central difference was in their self belief and self motivation. Which to large extent reflected in how they looked at same set of data and acted on it differently. Motivation and discipline were not the problem for most of them, while the others had these issues frequently.

From a more practical perspective based on my experience of long years of working with my students on trying to change mental models, I have found if you are looking for dramatic changes or "orbital changes" then you need to change your mental model significantly.

"Orbital changes" are changes which push you in to next level of orbit in terms of success or competency. These are very significant changes, requiring changing major set of beliefs and assumptions and freezing that new change and belief. I have seen such changes in many cases when the person was ready and motivated enough to make the change in mental models. I have seen some of the students changing their mental models dramatically , so much so that it surprised even their parents, people associated with them, their classmates and best friends. They just lifted themselves in to new orbit.

My home in India was a laboratory and I spent all my free time working with my students on mental modeling.I have been in touch with most of them over the years and seen how their life and career progressed since then. Changing mental models is easier for young people, as you get older you become more set in your belief and assumptions about world and life or your mental models get hard coded. Also once young people get convinced they can be very obedient. Mentoring relationships require certain degree of obedience for them to work. Hence commercial mentoring arrangements seldom work. It is not impossible, but more difficult process for older people plus culturally obedience is difficult thing to understand in American society. Sometime when people go through major life changes like death of close relative or friend, war, divorce, loss of job or any such event, such orbital changes in mental models happen.

Armies have structured programs to change mental models. Recently I was watching on Fit TV a program about elite Navy Seal training and it was all about changing mental models. While it was physically very challenging and rigorous, the overall emphasis was on mental modeling. The side interviews with those conducting the training again and again talked about the mental aspect of it. Those who completed it were interviewed in that program immediately after the training and after many months and they kept saying what that program did was to change their mind.

Cosmetic changes are easier and involve simple psychological intervention and much of the commonly used techniques like coaching, biofeedback, affirmation, counsellings,training etc. But dramatic changes require different approach.

It is my belief and observation after interacting with many different types of traders, that same mental modeling thing comes in to play in trading. Successful traders simply have different mental models. When you interact with them you become instantly aware of it. This week I interacted with a trader who sent an email based on what that person read here, now the moment I read the first email, I knew this person gets it, this person has a different mental model. Subsequently I had more interaction with the same person and it reaffirmed my earlier observation.

So if you are struggling with trading, you may need an orbital change in your mental model.

4/27/2007

Indicator soup

Whenever I post chart, invariably I get questions on what indicator do you use. Now long time readers know, there are no conventional indicators I use. Now there are many traders who swear by their indicator. Lot of time they believe in the indicator rationally or irrationally and it works. Indicators are much like placebos in medicine.

I have studied and thought about indicator a lot. Basically indicators are of three types- lagging, leading, and hybrid. Lagging indicators lag the price move. Almost all lagging indicators are derived by averaging series of values. All such average contain lag. SMA, EMA, Adaptive Moving Averages, and various other methods of deriving averages ultimately have lag.

Leading indicators are basically variation of Rate of Change. Leading indicator show acceleration and hence are called momentum indicator ( stochastics and many dozen other variations with different names of it are all leading indicator) The central hypothesis in such indicator is that trend decelerate before it can reverse. So divergence is what you look for in such indicator. The problem is many time the trend decelerate and instead of reversing it accelerates.So they tend to work in range bound markets, but are mostly useless in trending market.

Hybrid indicators like MACD are basically used to overcome problem with both lagging and leading indicator.

Then there are "belief" indicators like Gann, Fibonacci and several mystical variations of them. If you believe in them they work. If you believe in voodoo doctor voodoo medicine works.

As against all these indicator, what I look for is rate of change from a pivot low. The pivot might be 260 days low, or 65 days low or one month low. The advantage is it gives you absolute value. You can compare stocks. A stock having gone up 1087% in 260 days (FRPT) is different from a stock that is up 20% from the 260 days low. The value allows you to rank your stock and select. So faced with a 4% breakout or Episodic Pivot you can select the one which is up 100% plus or the other which is up 20% over same period of time. It is very simple and allows you to separate strongly trending stocks from non trending stocks.

The other problem with the way indicators are used by most traders is, they have absolutely no idea about how they are calculated. 90% of the traders who use MACD have no idea how it is derived. So there is often temptation to add more indicator. Ultimate result is an indicator soup.

Episodic Pivots

Earning season and general market froth is leading to lot of candidates coming in Episodic Pivot list. When markets correct and start fresh moves, you have very few candidates to work with and when you enter them, they have high success rate. EP in later part of market moves often have pullbacks and offer better entries after few weeks.

Here are only selected stocks from over 40 plus EP candidates yesterday.

ARM,Arvinmeritor Inc (Google  Yahoo  Earnings  Chart
BXXX,Brooke Corp (Google  Yahoo  Earnings  Chart
DBTK,Double-Take Software Inc (Google  Yahoo  Earnings  Chart
EPAY,Bottomline Technologies (Google  Yahoo  Earnings  Chart
GEL,Genesis Energy (L.P.) (Google  Yahoo  Earnings  Chart
LOOP,LoopNet Inc (Google  Yahoo  Earnings  Chart
MTH,Meritage Homes Corp (Google  Yahoo  Earnings  Chart
PLXS,Plexus Corp (Google  Yahoo  Earnings  Chart
VICR,Vicor Corp (Google  Yahoo  Earnings  Chart
WCAA,Wca Waste Corp (Google  Yahoo  Earnings  Chart
WST,West Pharmaceutical Svcs (Google  Yahoo  Earnings  Chart

VDSI and MBLX


mrstrader said...

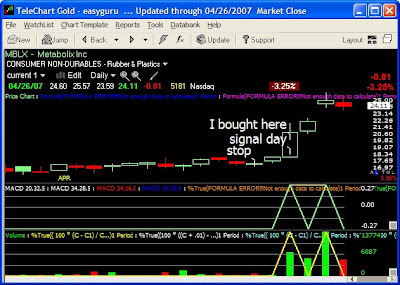
I would like to clarify how YOU handle gaps and I will use MBLX purely as an example. I bought on Monday at about 21. Lucky for me some guy on CNBC hawked it and it gapped up as high as 25.9 yesterday. Stopped out today using the 5% loss rule. Prior to coming to your sight I would have held because the chart still looks good to me but I figured I'd give your system a go. At what point would you reenter, a new high or a 2% move? Thanks
Apr 26, 2007 9:29:00 PM


Mrstrader please see my earlier post Why you should not trade any of the ideas discussed here

I do not know what stops you used and why. My stops are at 2 days low before entry day. So here is MBLX chart with entry and stops, as I see them and trade them. Current trailing stop is 22.43 as it made 20% plus move post entry.


JS said...

VDSI surged some 27% today. It is up 153% in 1 year. Would you consider today's surge (due to earnings) a EP, and trade the stock even though it has gone up considerably? Or would you wait for a pull back? Was this stock picked up on an earlier date by your scan and if so, would that scan have been a better entry point?
Apr 26, 2007 9:04:00 PM


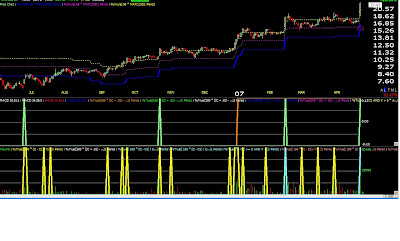
VDSI is up 225% in 260 days. The yellow spikes show 4% plus signal. Green and Light Blue show Episodic Pivots. Earlier entry points were better. It was an earnings trade 3-4 quarters ago when it doubled its earning and has gone up since then.VDSI was on IBD 200 for long periods of time in last one year and offered entry points then. IBD 200 stocks have lower price growth than 100% plus universe. So some of the good earnings candidates come from it.

Earnings Breakout

Here is a list from IBD of selected stocks with 100% plus earnings or 100% plus sales. Now those which had earnings yesterday morning have already reacted, as you can see in stocks like ALGN, VDSI, RKT, TMO on upside and CCBL and BW on downside.

ACTG,Acacia Research Acacia Tech (Google  Yahoo  Earnings  Chart
ALGN,Align Tech Inc (Google  Yahoo  Earnings  Chart
ALSK,Alaska Communctns Systms (Google  Yahoo  Earnings  Chart
BPL,Buckeye Partners (L.P.) (Google  Yahoo  Earnings  Chart
BW,Brush Engineered (Google  Yahoo  Earnings  Chart
CCBL,C-Cor Incorporated (Google  Yahoo  Earnings  Chart
CCO,Clear Channel Outdoor Holdings Inc (Google  Yahoo  Earnings  Chart
CTV,Commscope Inc (Google  Yahoo  Earnings  Chart
CY,Cypress Semiconductor Cp (Google  Yahoo  Earnings  Chart
EICU,Visicu Inc (Google  Yahoo  Earnings  Chart
EQIX,Equinix Inc (Google  Yahoo  Earnings  Chart
FSS,Federal Signal Corp (Google  Yahoo  Earnings  Chart
FSTR,L.B. Foster Co Cl A (Google  Yahoo  Earnings  Chart
IGTE,Igate Corporaion (Google  Yahoo  Earnings  Chart
MEE,Massey Energy Company (Google  Yahoo  Earnings  Chart
MEH,Midwest Express Holding (Google  Yahoo  Earnings  Chart
OPLK,Oplink Communications (Google  Yahoo  Earnings  Chart
OSIP,Osi Pharmaceuticals Inc (Google  Yahoo  Earnings  Chart
RKT,Rock-Tenn Co Cl A (Google  Yahoo  Earnings  Chart
SPR,Spirit Aerosystems Holdings (Google  Yahoo  Earnings  Chart
SPWR,SunPower Corp (Google  Yahoo  Earnings  Chart
TMO,Thermo Fisher Scientific Inc (Google  Yahoo  Earnings  Chart
TNH,Terra Nitrogen Co L.P. (Google  Yahoo  Earnings  Chart
ULTI,Ultimate Software Gp Inc (Google  Yahoo  Earnings  Chart
VDSI,Vasco Data Security Intl (Google  Yahoo  Earnings  Chart
VSEA,Varian Semiconductor Equipment Associates Inc (Google  Yahoo  Earnings  Chart
WFR,Memc Electronic Material (Google  Yahoo  Earnings  Chart


Some are up 20% plus coming in to earnings and are overextended and likely to revert. But few out of these will probably rally.I have put some on watch list, also from after hours trading you know which one are likely to go up and which one down. So accordingly some trades will work out.
Some day you get absolute neglected stocks and those are ideal. Those tracking morning earnings can find moves like VDSI ALGN, RKT, TMO etc. But I now days only look at evening releases. I still find my 20-25 trades in an earning season in them. Rest anyway show up on Episodic Pivot.
If you see yesterday's 100% plus list CNS, DBTK, MLNX triggered on upside. While HLIT and TSCO on downside.
The first few weeks are dominated by large caps in earnings season, next week onwards the small caps and lesser known companies will start announcing earnings and that is when fun will start.
Also if you keep a database of 100% plus stocks , in few weeks you will notice some of those which had big moves on earnings forming cup with handle and some forming flat bases. Such stocks offer another entry point later.

You will also notice IBD will highlight either on its front page or in New America some of the stocks with triple digit plus earnings or those stocks which had high volume breakout on earnings day. The stocks highlighted in IBD opinion are the ones to focus on. Many of them make major move in a quarter or two. For example WFR, ROCM, TSL, BTJ, SPAR, were somee stock highlighted in IBD after last earnings and they went on to gain after that. If you keep a close watch you will find majority of New America candidates have triple digit plus earnings growth in recent quarters.

How are New America companies selected?
The editors of The New America screen for companies that show robust year-over-year increases in earnings and revenue. Their stocks must be outperforming the general market, and are usually priced above $10 a share. In some cases, the company has just recently turned profitable or is rebounding out of a business slump. New America story candidates usually have an innovative new product or service or are benefiting from a major new industry trend.

Market Monitor

  • Apple (AAPL), Exxon Mobil (XOM) and 3M (MMM) earnings and positive sentiment withstanding the averages finished mixed. Breadth was again negative.
  • 173 stocks were up but the number to watch is 105 down. The down movs have been increasing, indicating rotation.
  • Rotation is also visible in 987/252 numbers which have stalled and not improved.
  • Several gap ups on flimsy news early in the morning in many cases, indicating red hot momentum.
  • The market is currently in full momentum mode
  • Corrections have a nasty habit of appearing when trading becomes too easy and things you buy go up 20% plus in few days of your buying.
  • My other Idiot/ Boast indicator is at red territory. Yesterday I got 3 emails telling how the Market Monitor is useless and how I am an idiot for my call on AMZN and imploring me to"just buy, just buy, just buy".
Market Monitor

Total 4% plus bullish breakouts = 173

Total 4% plus bearish breakouts = 105

65 day bullish/bearish ratio = 987/252

Stocks up 50% or more in a month = 8

Stocks up 25% or more in a month = 101

Number of stocks with 100% plus move = 440

Number of stocks up 200% or more = 96

4% plus signals for 100plus universe = 32

4% plus signals for 200plus universe = 7

You know market has changed in its nature and new group of stocks are taking momentum leadership when you are completely wrong in your judgment. AMZN is clear case of that. After I made a fool of myself by saying large caps seldom make 50% plus moves, guess what AMZN is in the proud member of the 50% plus in a month list. The revenge of the large caps after many years of sub par growth.

4/26/2007

Double Trouble

There are total 32 4% plus movers in Double Trouble universe today. The 13 stocks below have weakness or consolidation in last few days before the breakout.

ARGN,Amerigon Inc (Google  Yahoo  Earnings  Chart
AVT,Avnet Inc (Google  Yahoo  Earnings  Chart
CNS,Cohen & Steers Inc (Google  Yahoo  Earnings  Chart
GEL,Genesis Energy (L.P.) (Google  Yahoo  Earnings  Chart
INOD,Innodata Isogen Inc (Google  Yahoo  Earnings  Chart
ISSC,Innovative Solutions (Google  Yahoo  Earnings  Chart
NTY,Nbty Inc (Google  Yahoo  Earnings  Chart
PHRM,Pharmion Corp (Google  Yahoo  Earnings  Chart
POZN,Pozen Incorporated (Google  Yahoo  Earnings  Chart
RKT,Rock-Tenn Co Cl A (Google  Yahoo  Earnings  Chart
SSYS,Stratasys Inc (Google  Yahoo  Earnings  Chart
SVVS,SAVVIS Inc (Google  Yahoo  Earnings  Chart
VDSI,Vasco Data Security Intl (Google  Yahoo  Earnings  Chart

Gap and trap

I am noticing so many gaps today. Some are on below normal volume. Yesterday's move created the euphoria and clearly even minor catalysts and not so good earnings are leading to gap ups.

Now when market starts moving in gaps and stocks start moving in gaps after a long run, can correction be far away.

We are in an abnormal market conditions currently.

Note: I am aware of the comment widget not working in sidebar. This happens when blogger updates some software at their end. Will try and fix the code later to night.

Breakdowns

The earning season also has its losers and sometime some of them go in to multi month down spiral. Earnings disappointments or earnings slowdown after strings of good quarters can lead to such action.
The earning season also leads to new leadership emerging. Clearly this earnings season the large caps are emerging as leaders.

The following stocks had negative Episodic Pivots.

AKAM,Akamai Technologies Inc (Google  Yahoo  Earnings  Chart
ANAD,Anadigics Inc (Google  Yahoo  Earnings  Chart
CTHR,Charles & Colvard Ltd (Google  Yahoo  Earnings  Chart
DTLK,Datalink Corporation (Google  Yahoo  Earnings  Chart
EML,Eastern Co (Google  Yahoo  Earnings  Chart
ENWV,Endwave Corporation (Google  Yahoo  Earnings  Chart
EXBD,Corporate Exec Board Co (Google  Yahoo  Earnings  Chart
HTCH,Hutchinson Technolgy Inc (Google  Yahoo  Earnings  Chart
SI,Siemens Aktien (Google  Yahoo  Earnings  Chart
SUNW,Sun Microsystems Inc (Google  Yahoo  Earnings  Chart
TAYC,Taylor Capital Group Inc (Google  Yahoo  Earnings  Chart
TZOO,Travelzoo Inc (Google  Yahoo  Earnings  Chart

4/25/2007

Market Monitor

Market rallied with number of stocks making wild moves. But 4% plus breakout levels did not even cross 200. 4% plus breakdowns were 68. On real push ups the figures tend to extremely lopsided.

The action still continues to be dominated by large caps. Large caps gapping up on earnings is the trend in this season. But large caps do not just gap and go. They simply do not have the potential to make 50% kind of moves in a month unless takeovers are involved.

The small caps are the ones which offer best risk rewards and the Russell Index seems to have stalled, so if the overall move has more upside at some stage small caps should catch fire. Keep a close watch on Russell for clues.


Market Monitor


Total 4% plus bullish breakouts = 186

Total 4% plus bearish breakouts = 68

65 day bullish/bearish ratio = 995/240

Stocks up 50% or more in a month = 6

Stocks up 25% or more in a month = 83

Number of stocks with 100% plus move = 423

Number of stocks up 200% or more = 99

4% plus signals for 100plus universe = 44

4% plus signals for 200plus universe =9


Breakouts

AMZN,Amazon.Com Inc (Google  Yahoo  Earnings  Chart
ARRY,Array Biopharma Inc (Google  Yahoo  Earnings  Chart
BCSI,Blue Coat Systems Inc (Google  Yahoo  Earnings  Chart
BDSI,Biodelivery Sciences Intl Inc (Google  Yahoo  Earnings  Chart
BSQR,bSquare Corp (Google  Yahoo  Earnings  Chart
BTJ,Bolt Technology Corp (Google  Yahoo  Earnings  Chart
BVX,Bovie Medical Systems (Google  Yahoo  Earnings  Chart
CHAP,Chaparral Steel Company (Google  Yahoo  Earnings  Chart
DXPE,Dxp Enterprises Inc (Google  Yahoo  Earnings  Chart
FEIC,Fei Company (Google  Yahoo  Earnings  Chart
GRIL,Grill Concepts Inc (Google  Yahoo  Earnings  Chart
GTI,Graftech Intl Ltd (Google  Yahoo  Earnings  Chart
IDSA,Industrial Svcs Of Amer (Google  Yahoo  Earnings  Chart
IGLD,Internet Gold-Golden (Google  Yahoo  Earnings  Chart
IOC,Interoil Corporation (Google  Yahoo  Earnings  Chart
JAS,Jo-ann Stores Inc (Google  Yahoo  Earnings  Chart
LBY,Libbey Inc (Google  Yahoo  Earnings  Chart
LEA,Lear Corp (Google  Yahoo  Earnings  Chart
LNET,Lodgenet Entertainment (Google  Yahoo  Earnings  Chart
LQDT,Liquidity Services (Google  Yahoo  Earnings  Chart
MCF,Contango Oil & Gas (Google  Yahoo  Earnings  Chart
MEH,Midwest Express Holding (Google  Yahoo  Earnings  Chart
METH,Methode Electronics Cl A (Google  Yahoo  Earnings  Chart
NXST,Nexstar Broadcasting Group (Google  Yahoo  Earnings  Chart
OMCL,Omnicell Inc (Google  Yahoo  Earnings  Chart
PARD,Poniard Pharmaceuticals (Google  Yahoo  Earnings  Chart
PERY,Perry Ellis Int'l (Google  Yahoo  Earnings  Chart
ROCM,Rochester Medical Corp (Google  Yahoo  Earnings  Chart
RVBD,Riverbed Technologies Inc (Google  Yahoo  Earnings  Chart
SGG,Sgl Carbon Aktiengesells (Google  Yahoo  Earnings  Chart
SUF,SulphCo Inc (Google  Yahoo  Earnings  Chart
TSO,Tesoro Corp (Google  Yahoo  Earnings  Chart
TVL,Lin Tv Corp (Google  Yahoo  Earnings  Chart
VHI,Valhi Inc (Google  Yahoo  Earnings  Chart
VLCM,Volcom Inc (Google  Yahoo  Earnings  Chart
VOLV,Ab Volvo Adr (Google  Yahoo  Earnings  Chart
VYYO,Vyyo Incorporated (Google  Yahoo  Earnings  Chart
WNR,Western Refining Inc (Google  Yahoo  Earnings  Chart
XNPT,XenoPort Inc (Google  Yahoo  Earnings  Chart