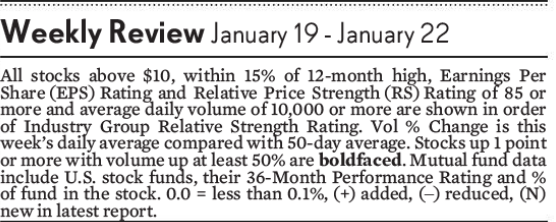
Every Friday the IBD newspaper publishes a list of stocks under Your Weekly Review. These stocks list is a curated list of stocks with growth and momentum and extremely good source of ideas for growth investor.
Basically it is list of stocks with:
- 85 plus EPS ratings (that means they are in top 15% in relative rank in terms of their earnings growth)
- 85 Relative Strength rating (that means in top 15% by price momentum rank )
- 15% of 52 week high
- 50 day daily average volume above 100000
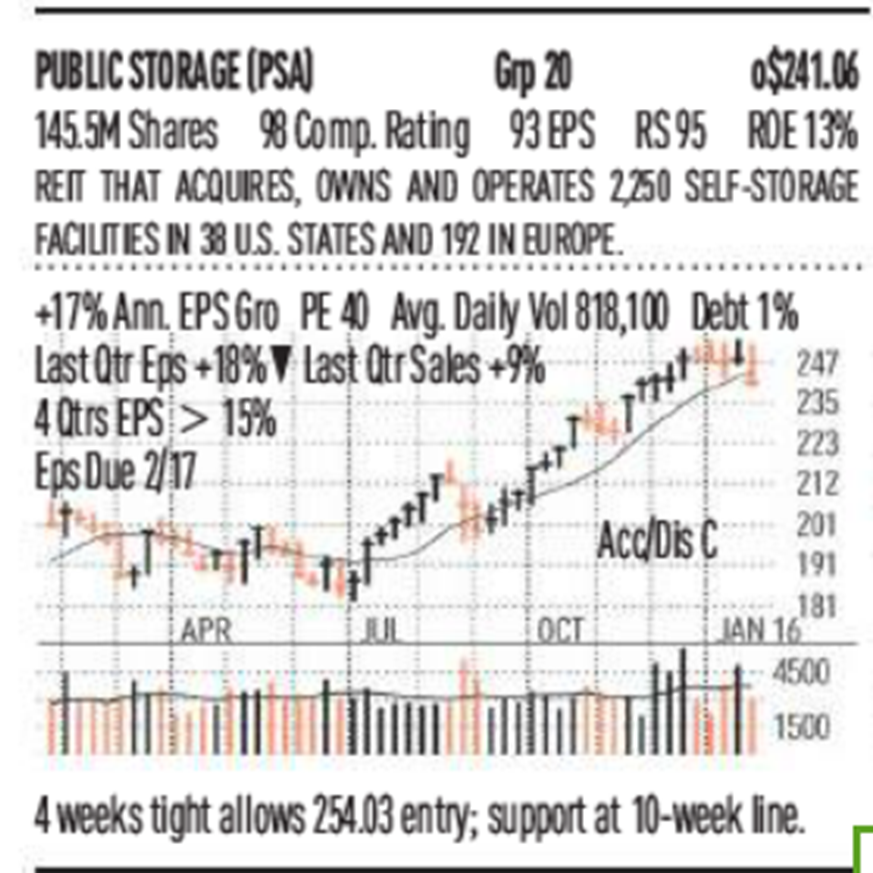
Essentially it is a list of growth stocks with momentum. It is published on Friday so that subscribers can study it on weekend and create their watch list for next week.
If you are a growth investor with limited time to focus on market during the week, you should focus like laser on this list. Study the stocks in the list. See if any of them is setting up for a breakout. At what price should you buy it. Where should you put stop, you can figure that out ahead of time.
Study the new entrant to the list as they offer new opportunities in the market. Look at IPO making it to the list and steady them.
Growth investing tries to find few home run growth stocks during the year while swing trading other growth ideas for 10 to 20% gain. The focus of your IBD 85-85 list study should be to try and find that one or 2 explosive growth ideas that are likely to make big move of 100% to 500% or more in a year. Or a growth idea with multi year legs which will keep going up for many years as it is in secular growth trend
. 
If you subscribe to Marketsmith, then you can generate this list daily by using a simple scan and that way you may not miss any stock that makes to the list during the week. The image shows how you can do that in that scanner.
The key to using it is to develop a process flow to analyse the list weekly or daily and then identify good anticipation setup and figure out your entry point and then focus on entering that position during the week if triggered.