1/31/2007

A stocks which made 1500% move in a year- What are significant moves


Here is a stock which has gone up around 1500% in last 260 days.That is a significant move.
FRPT,Force Protection Inc (Google  Yahoo  Earnings  Chart

What is a significant move in a stock. Assuming you are not a high frequency day trader, then you would define significant move as 5% in a day for individual stock. If you add say another criteria of saying the 5% move should be accompanied by volume increase over yesterday. So lets say 5% move on higher volume is significant. The real reason for this is to find out how many stocks make that kind of a move in a day. Supposing 5% of the total universe of stock on a given day has 5% move, is that significant.Does a one day significant move indicate future returns.

Many of the things which I look at on daily basis and monitor is basically a variation of significant moves on various time frames. A 5% move on individual stock on higher volume with a cut off off 100000 plus volume to me is significant move based on past studies of stock price moves. Similarly a move of 2% on any of the Index is significant. Or a move of 2% on a sector is significant. It is more significant if it happens on higher volume.

Taking the same logic further a 50% move in a stock in a month is extremely significant move. It indicates an aberration. A 25% move in a month in a stock is on a significance scale also very significant.A 25% move in a quarter is significant in a market where the average long term drift is less than two digits. Similarly a move of 100% in a year on a stock is a significant move.

Now if you constantly study significant moves and build an iterative model over a period of time you will probably learn a lot about such moves. A brute force backtesting might give you even greater understanding in to such moves. A combination of backtesting and continuous iteration gives you a live model of what makes a stock make a significant move.

Largely my study of significant moves supplemented by additional insights has helped me understand what kind of stocks are likely to make a significant move for a given time frame. There are factors one can isolate which increase probability of a stock making a significant move. That gives you a significant edge in avoiding the bad or low probability trades.

Here are 25 stocks which have made significant moves in last 260 days. Is there any thing one can learn from them. How many of them are on your radar.
ANGN,Angeion Corp (Google  Yahoo  Earnings  Chart
CHDX,Chindex International Inc (Google  Yahoo  Earnings  Chart
CLEC,Us Lec Corp Cl A (Google  Yahoo  Earnings  Chart
CRVL,Corvel Corp (Google  Yahoo  Earnings  Chart
CTDC,China Technology Development Group Corp (Google  Yahoo  Earnings  Chart
ENPT,En Pointe Technologies (Google  Yahoo  Earnings  Chart
FTGX,FiberNet Telecom Group Inc (Google  Yahoo  Earnings  Chart
GVP,Gse Systems Inc (Google  Yahoo  Earnings  Chart
HTI,Halozyme Therapeutics Inc (Google  Yahoo  Earnings  Chart
INAP,Internap Network Svcs Cp (Google  Yahoo  Earnings  Chart
ININ,Interactive Intelligence (Google  Yahoo  Earnings  Chart
ISIG,Insignia Systems Inc (Google  Yahoo  Earnings  Chart
KNOL,Knology Inc (Google  Yahoo  Earnings  Chart
MEMY,Memory Pharmaceuticals (Google  Yahoo  Earnings  Chart
MSI,Movie Star Inc (Google  Yahoo  Earnings  Chart
NAVI,Navisite Incorporated (Google  Yahoo  Earnings  Chart
ONSM,Onstream Media (Google  Yahoo  Earnings  Chart
PRGX,Prg-schultz Intl Inc (Google  Yahoo  Earnings  Chart
PRH,VitaCube Systems Holdings Inc (Google  Yahoo  Earnings  Chart
PTT,Vcg Holding Copr (Google  Yahoo  Earnings  Chart
ROHI,Rotech Healthcare Inc (Google  Yahoo  Earnings  Chart
SLP,Simulations Plus Inc (Google  Yahoo  Earnings  Chart
SMTK,SIMTEK Corp (Google  Yahoo  Earnings  Chart
SOFO,Sonic Foundry Inc (Google  Yahoo  Earnings  Chart
SVVS,SAVVIS Inc (Google  Yahoo  Earnings  Chart

Studying significant moves on daily basis can give you a significant edge in finding stocks likely to make significant moves in the future.

More posts in this series: Significant Moves

Small caps are stirring

Bulk of the action in the market since July was dominated by large caps and mid caps. The small caps had a minor role to play. After a few months of consolidation, a hint of a rally is developing in small caps. In last couple of weeks the large caps have mostly been consolidating or pulling back.The AMEX index is quitely moving up now for few weeks.
Monday was the first day I started finding lots of small caps in scans and yesterday also there were more than 156 stocks up more than 5% on higher volume. The small caps are very good trading vehicles in my scheme of things. Even a small catalyst can propel a small cap stock 25% plus in a quarter. Inefficiencies are more evident in small caps and low float stocks than in large caps.
While two days action might be just a fluke, there are other interesting things showing up in my indicators. The Stock up 50% or more is at 9 by end of yesterday. Levels above 10 indicate a good momentum on individual stocks. Now this indicator is climbing back after making a low last week, which again shows momentum accelerating rather than decelerating. Inference more sectors , stocks breaking out to upside. Similarly my other indicators like number of stocks making 25% move in 65 days and number of stocks up 100% in a year have started climbing back after hitting bottom last week. So tentatively indicating a broadening of rally.
When a market gets stuck in a range, there is lot of churning. Stocks which have gone up go in to correction. While most of the attention gets focused on those stocks, new set of stocks and sectors start their upward march, most of the time the overall weakness in index can mask this. Over a period of time I have developed an overall market monitoring mechanism to try and capture some of these moves earlier. I will have more about it later today......

1/30/2007

Breakouts

Looks like another day with 100 plus breakouts. More new sectors and stocks are witnessing high volume breakouts. Earning lead breakouts continue to work. Trucking and shipping are witnessing number of breakouts.

AGIX,Atherogenics Inc (Google  Yahoo  Earnings  Chart
ALGN,Align Tech Inc (Google  Yahoo  Earnings  Chart
ALTH,Allos Therapeutics Inc. (Google  Yahoo  Earnings  Chart
BTJ,Bolt Technology Corp (Google  Yahoo  Earnings  Chart
BYI,Bally Technologies Inc (Google  Yahoo  Earnings  Chart
CNW,Con-Way Inc (Google  Yahoo  Earnings  Chart
CPRX,Catalyst Pharmaceuticals (Google  Yahoo  Earnings  Chart
FBNC,First Bancorp Nc (Google  Yahoo  Earnings  Chart
FCL,Foundation Coal Holdings (Google  Yahoo  Earnings  Chart
FHN,First Horizon Natl (Google  Yahoo  Earnings  Chart
GIB,Cgi Group Inc (Google  Yahoo  Earnings  Chart
IEX,Idex Corp (Google  Yahoo  Earnings  Chart
IFON,Infosonics (Google  Yahoo  Earnings  Chart
ISSC,Innovative Solutions (Google  Yahoo  Earnings  Chart
ITW,Illinois Tool Works Inc (Google  Yahoo  Earnings  Chart
IXYS,Ixys Corporation (Google  Yahoo  Earnings  Chart
JDAS,Jda Software Group Inc (Google  Yahoo  Earnings  Chart
KRON,Kronos Inc (Google  Yahoo  Earnings  Chart
LPSN,Liveperson Inc (Google  Yahoo  Earnings  Chart
NBL,Noble Energy Inc (Google  Yahoo  Earnings  Chart
OIL,iPath Goldman Sachs Crude Oil TR Idx ETN (Oil) (Google  Yahoo  Earnings  Chart
PACT,Pacificnet Inc (Google  Yahoo  Earnings  Chart
PIR,Pier 1 Imports Inc (Google  Yahoo  Earnings  Chart
RGA,Reinsurance Group Of Am (Google  Yahoo  Earnings  Chart
RPRX,Repros Therapeutics Inc (Google  Yahoo  Earnings  Chart
RTI,Rti Internat Metal Inc (Google  Yahoo  Earnings  Chart
SSTI,Silicon Storage Tech Inc (Google  Yahoo  Earnings  Chart
STKL,Sunopta Inc (Google  Yahoo  Earnings  Chart
TCHC,21st Century Holdings (Google  Yahoo  Earnings  Chart
TSU,Tim Partcipacoes S.A. (Google  Yahoo  Earnings  Chart
TWI,Titan Internat Inc (Google  Yahoo  Earnings  Chart
UNM,Unumprovident Corp (Google  Yahoo  Earnings  Chart
USO,United States Oil Fund ETF (Google  Yahoo  Earnings  Chart
USTR,United Stationers Inc (Google  Yahoo  Earnings  Chart
X,US Steel Corp (Google  Yahoo  Earnings  Chart
YRCW,YRC Worldwide Inc (Google  Yahoo  Earnings  Chart
ZMH,Zimmer Holdings (Google  Yahoo  Earnings  Chart

Earnings expectations and Cinderella Strategy


Some days back I talked about the importance of overall contextual framework for any strategy. Once the conceptual framework is understood it is easier to implement a strategy. Much of the work on my earnings based modelling has been based on a book by Richard Bernstein.

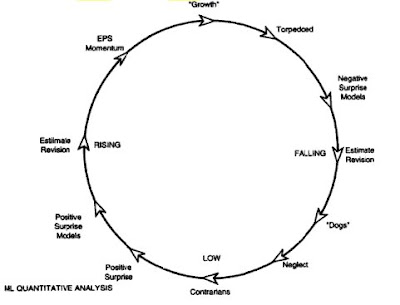
Merrill Lynch quantitative strategist Richard Bernstein in his book Style Investing: Unique Insight Into Equity Management offers a very useful conceptual framework for understanding the role of earnings and earnings expectations in stocks price growth.

Bernstein's earnings expectations model compares earnings expectations of a typical company on a clock face. When a company is at its pinnacle in growth term it is at 12.00 midnight. In his book he offers a strategy to identify stocks early enough in their growth cycle. The idea is to find growth stocks early enough but not to overstay the party. That is why the name Cinderella strategy- you should not overstay the growth party and must leave the party before midnight.
The strategy basically offers a choice of value investing or growth investing based on how early you identify earnings potential of a stock.

12 to 3
12 o’clock: The company’s earnings are high and expectations are also very high
1 o’clock: Torpedo is a negative earning surprise
3 o’clock: Analysts revise earnings estimates downward. Growth investors abandon the stock.
3 to 6
4 o’clock: Earnings expectations continue to fall dramatically.
6 o’clock: At some stage earnings expectations reach their low point. At this point most of the bad news is priced in. Expectations are at lowest level.
6 to 9
This is where value investors focus. Value investors want to buy stocks neglected by market but which have the potential to surprise on earnings front. They want to buy it before the earning surprise. One of the risk of value approach is if you buy too early, you have to wait a long time.
7 o’clock: Stock has a positive earnings surprise. If it is a genuine turnaround there will be more surprises down the line.
9 o’clock: Market starts to recognise the stock and its earning potential.
9 to 12
This is where primarily growth investors focus. They want companies that have exhibited consistent earnings growth over several quarters. They pay premium for such stocks as the stock has already moved from low expectations to high. The value investors pass on these stocks to growth investors during this transition phase. The risk of growth investing is overstaying the party beyond midnight.
11 o’clock: Everyone becomes aware of the company.
12 o’clock: Earnings and earnings expectations reach peak.

The CANSLIM strategy primarily operates in the 9 to 12 quadrant. That is one of the reason many of the stocks on IBD 100 can break down also after appearing in the list. Earnings lead breakouts operates primarily in the 6 to 9 quadrant. Building a mix of earnings based strategies in the 6 to 12'o clock time frame gives you best of both worlds.

Range bound markets and opportunities

The market continues to be range bound. While the rally leaders pullback or breakdown, a broad based sector rotation is at play. The new sectors breaking out offer some very good low risk opportunities for entries.
Yesterday I had over 100 breakouts in my scans. Several of them have the right earnings catalyst and relative strength plus sector fuel to take them higher. If you see the following list, you should find ample opportunities on long side:
Selected breakouts with potential:
AOI,Alliance One International Inc (Google  Yahoo  Earnings  Chart
BMRN,Biomarin Pharmaceuticals (Google  Yahoo  Earnings  Chart
BPFH,Boston Private Fincl Hld (Google  Yahoo  Earnings  Chart
CSIQ,Canadian Solar Inc (Google  Yahoo  Earnings  Chart
ESLR,Evergreen Solar Inc (Google  Yahoo  Earnings  Chart
FBP,First Bancorp Holding Co (Google  Yahoo  Earnings  Chart
FCEL,Fuelcell Energy Inc (Google  Yahoo  Earnings  Chart
FLML,Flamel Technologies Sa (Google  Yahoo  Earnings  Chart
FSLR,First Solar Inc (Google  Yahoo  Earnings  Chart
FSYS,Fuel Systems Solutions Inc (Google  Yahoo  Earnings  Chart
GNTX,Gentex Corp (Google  Yahoo  Earnings  Chart
GYI,Getty Images Inc (Google  Yahoo  Earnings  Chart
HLS,Healthsouth Corp (Google  Yahoo  Earnings  Chart
IMCL,Imclone Systems Inc (Google  Yahoo  Earnings  Chart
IPSU,Imperial Sugar Company (Google  Yahoo  Earnings  Chart
IRM,Iron Mountain Inc (Google  Yahoo  Earnings  Chart
JST,Jinpan Internat Ltd (Google  Yahoo  Earnings  Chart
LYO,Lyondell Chemical Co (Google  Yahoo  Earnings  Chart
OFG,Oriental Financial Group (Google  Yahoo  Earnings  Chart
PERY,Perry Ellis Int'l (Google  Yahoo  Earnings  Chart
PFBC,Preferred Bank Los Angeles (Google  Yahoo  Earnings  Chart
POT,Potash Cp Saskatchewan (Google  Yahoo  Earnings  Chart
QLTI,Qlt Inc (Google  Yahoo  Earnings  Chart
RGR,Sturm Ruger & Co Inc (Google  Yahoo  Earnings  Chart
SBH,Sally Beauty Holdings Inc. (Google  Yahoo  Earnings  Chart
SBNY,Signature Bank (Google  Yahoo  Earnings  Chart
SIGM,Sigma Designs Inc (Google  Yahoo  Earnings  Chart
SILC,Silicom Ltd (Google  Yahoo  Earnings  Chart
SIRO,Sirona Dental Systems Inc (Google  Yahoo  Earnings  Chart
SOHU,Sohu.Com Inc (Google  Yahoo  Earnings  Chart
SPAR,Spartan Motors Inc (Google  Yahoo  Earnings  Chart
STLD,Steel Dynamics Inc (Google  Yahoo  Earnings  Chart
STP,Suntech Power Holdings Co Ltd (Google  Yahoo  Earnings  Chart
TDG,TransDigm Group Inc (Google  Yahoo  Earnings  Chart
TRCR,Transcend Services Inc (Google  Yahoo  Earnings  Chart
TRID,Trident Microsystems Inc (Google  Yahoo  Earnings  Chart
TSCM,Thestreet.Com (Google  Yahoo  Earnings  Chart
TSL,Trina Solar Ltd. (Google  Yahoo  Earnings  Chart
USAP,Universal Stain & Alloy (Google  Yahoo  Earnings  Chart
UTI,Universal Technical Institute (Google  Yahoo  Earnings  Chart
WWW,Wolverine World Wide (Google  Yahoo  Earnings  Chart
XIDE,Exide Tech (Google  Yahoo  Earnings  Chart

What are the sector themes emerging. Solar energy, every single stock related to solar energy is breaking out. Clearly the market seems to like the prospect for solar plays. Steel and metal is another sector witnessing breakouts in last couple of days. These sectors are breaking out after a few quarters of good earnings. Regional Banks are also breaking out. In last couple of weeks Regional Banks have seen large scale breakouts after many months of unerperformance. Other sectors where there are fresh breakouts is large cap biotechs, auto parts and aerospace.
So even though market is stuck in range there are lots of opportunities.

1/29/2007

Markets at Crossroads

Last week had all the excitement the short term traders crave. Breakouts to new high on indexes followed by a reversal followed by no follow through. End result, markets are where they are. The month end effect should keep the market in stalemate stage for sometime.

Earnings trends:
So far the earning season has been good. Companies have mastered the art of setting low expectations and beating them. But early trends indicate yet anther double digit growth in earnings. So in absolute terms earnings are good.
The problem is forward guidance. For the first time after a series of good quarters, the forward guidance is uniformly lacklustre. So far the sector picture emerging from the earnings favor insurance, financial brokerage and material sector. Many of the stocks in this sector have already rallied in anticipation of this.

Interest rates and inflation

If you go back few quarters, the market theme was slowdown in US economy. Depending on who you listened to, there were extremists predicting doom and gloom and there were others predicting resilient economy. The bonds were moving in the recession camp. Now with more data coming in inflation seems to be back as the theme. Contrary to the predictions of the gloom and doom camp the world economies have accelerated growth and in countries after countries inflation fighting measures are being taken to slow down growth. Rising interest rates are never good for the markets.

Leading stock action
When the leaders falter be careful. The leaders which lead the rally since July are stalling and in many cases exhibiting signs of blowout moves or reversal. Look at stocks like AAPL, RIMM, GOOG, IAAC, GROW, CSH, MWRK, LCC, AMR, etc. They have stalled and not moving forward.
The Investors Business Daily indicator of distribution days on Indices shows 3 days for Nasdaq and 3 for S&P in last 4 weeks. 4 plus levels are indicative of short term tops.
My own Stocks Up %0% or More in a Month indicator is at 3. That indicates lack of market momentum at individual stock level. In a rising markets the levels are between 10-20. So at individual stock levels there are very few strong moves.

Overall we are at an interesting crossroads and the probability of next move down is high. The only sector which seems to be attracting longer term interest is Technology, where the earnings are not so good but there are number of breakouts post earnings. So probably there is an anticipation of better days ahead in few quarters.

1/26/2007

Dilbert portfolio up 1%

I am sure you will have James Altucher adding Dilbert Portfolio to his site and will have a column on TheStreet.com about "How to invest like Dilbert" soon.

Dilbert Portfolio Update
Last year I asked my wise readers to recommend stocks that would be sure winners in the future. I compiled the best and most frequent suggestions into the Dilbert Portfolio. I confidently invested $75K in the portfolio. This seemed like easy money, given the crackling intellect and nearly godlike forecasting powers of my readership.

So how’s that portfolio doing in a market that is way up during the same period?

ADM: -23%
BHP: -16%
IN: -9%
PEIX: -56%

Overall: -26%

Ouch.

Luckily for me, three of the four stocks jumped in value soon after I bought them. I placed my stop orders and they automatically sold for tidy profits in just a few weeks when they changed directions:

ADM: sold for 9% gain
IN: sold for 10% gain
PEIX: sold for 9% gain

Not bad for a few weeks. Unfortunately for me, my largest holding (because I bought 500 shares of each stock regardless of price) was BHP. It never jumped in value and I held it. It’s down 16%. But with a forward P/E of 9.8, and growing demand for their products, it still looks cheap. So I’m keeping it. As with most of my stock picks, they become real bargains sometime AFTER I buy them.

My current overall return, including BHP’s drag, is up 1%. Had I not been too lazy to do the math when I first invested in the portfolio, I would have bought equal dollar values in each company, instead of an equal number of shares, and I would have been up a few percentage points more.

Still, by any measure, the Dilbert Portfolio has been a disappointment despite all of the good thinking that went into it.

Soon, many of you will be asked to cast votes in a major election. Good luck with that.

Big edge or small edge

As I mentioned some days ago, my plan this year is to go through all old books, articles and research which I have previously read instead of new books. One of the recurring theme once you start going through the material is big edge or small edge.
Big edge is structural, it is based on some fundamental understanding of how market works. It is enduring and it is narrow focused. For example take Peter Lynch. His objective was to find ten baggers. His entire edge was based on that key insight as to how to identify stocks early enough with potential to make a ten times move. Everything revolved around building that big edge. That lead him to concentrate on new innovative, young companies and research them thoroughly. In his long career, he found several of them. You will find similar stories of traders who wanted a big edge and found it using several methods.
On the other hand look around, you have proliferation of people claiming they have 25 cents edge or 1% or 5% edge. The meme going around is if you can find 1% everyday then ....... Most of these people use some sort of voodoo science of technical analysis to find such edges. Most of these edges are ephemeral and that is one of the reason you will find they vanish and many of the small edge traders periodically go through existential crisis.
The other problem with small edges is your cost of trading is very high. All those using small edges need several tools to identify their entries and exists. They need real time data, expensive scanning software and multi monitor set ups. Everything in small edges is tactical.If you have large edge you don't need all those fancy and expensive tools to find trades.
Another problem faced by small edge traders is psychological. So much of their results and outcome depend on their state of mind. Unless everyday they are perfectly psychologically aligned, they can not exploit their minuscule edge. Because if your edge is 1%, before you blink that opportunity is over. The psychologist catering to traders have found a receptive audience amongst these small edge traders. There is proliferation of psychological tools, profiles, tapes, 3 things to do kind of talismans being offered to these traders.
Many of these traders who can find 1% or 5% edges would significantly improve their returns, if they changed their focus to finding 10% or 50% edge, but often activity is more alluring than profitability.
As a trader there is a choice whether to pursue small edge or large edge. In a market where bulk of the participants are trying to perfect small edges, as a contrarian strategy itself, you should look at large edge. The paths to acquiring the edge are different depending on the choice you made. Like Peter Lynch if you went around in search of 10 baggers you will find several of them, same way if you look for 1% you will find 1%.

Did the market rally on Wednesday?

Markets have been unable to move to either direction strongly since Thanksgiving. The muddled market action continued yesterday. The indexes reversed their gains. Those who aggressively bought on Wednesday were shaken and stirred. There was no bid for the entire day. Which indicates large scale liquidation of position by some large speculators. They just used the Wednesday strength to dump some supply. When a market starting from morning just keeps going down, generally the market participants know a large seller is around and buyers and bid disappear. Expect a bounce as the dip buyers and bottom fishers go to work.

While the index action looked scary, on actual stock level it is not reflected in number of stocks down 5% or more on high volume. In fact my 5% scan shows 59 up breakout to 72down breaks. When markets really have bad days these numbers would look like 20:200. Also to add intrigue, my trusty stocks up 50% or more in a month has only one stock in the list currently. PRXI, Premier Exhibitions Inc. is the only stock on that list currently, which I highlighted as the earnings breakout few days ago. Levels below 5 on the stocks up 50% or more breakout are normally seen after a sustained weakness. The low number indicates market on individual stock level has had poor momentum. So essentially market is churning. There are 53 stocks on the stocks up 25% or more list.The 65 day bull to bear ration is again deteriorating and is at 763:275. Message of the market is muddled. We are stuck in the range and high probability is that the next leg is going to be down.

Many of my short scans are showing candidates after a long time. Most of my short scans are designed to give signal only rarely, because shorts work rarely. When I see 11 stocks on the list, may be the season for shorts might be around the corner.

Stocks showing up on short scans
ACXM,Acxiom Corp (Google  Yahoo  Earnings  Chart
BSC,Bear Stearns Companies (Google  Yahoo  Earnings  Chart
CHIC,Charlotte Russe Hldg Inc (Google  Yahoo  Earnings  Chart
FXI,iShares FTSE/Xinhua China 25 Index Fund ETF (Google  Yahoo  Earnings  Chart
GOOG,Google (Google  Yahoo  Earnings  Chart
GS,Goldman Sachs Group Inc (Google  Yahoo  Earnings  Chart
IKN,Ikon Office Solutions (Google  Yahoo  Earnings  Chart
MEOH,Methanex Corporation (Google  Yahoo  Earnings  Chart
MIPS,Mips Technologies Inc (Google  Yahoo  Earnings  Chart
PLXS,Plexus Corp (Google  Yahoo  Earnings  Chart
TGIC,Triad Guaranty Inc (Google  Yahoo  Earnings  Chart

All the recent earnings play highlighted here PRXI, ELY, TDG,ATI have continued to act well and many of them are due for correction. ATI is the one which I was worried about most so I took off that position for a nice few points gain. On PRXI stops have been moved to protect the gain.  Like PRXI, there will be more earnings plays during this season.TRCR is another earnings play which looks to be shaping up well. There are couple of more from yesterdays earnings breakout list which look promising.HLYS, which I talked about few days back got moving again after few days breakout. It was blessed by the Trading Goddess

Coming in to this earnings season, I had low expectations for finding many plays as against last few earning season, but the earning season is not yet over and I am pretty confident of finding around 20 plays which will make 25% plus moves in the quarter, even if the market takes a dive from here, I am not very worried. If there is a strong earning catalyst nothing can stop a stock from making 25% kind of move in a quarter. There are over 6000 stocks yet to announce their earnings, so opportunities will be there if you understand how to play the earnings game. Earnings related strategies are my bread and butter. I play various variations of the earnings strategy, earnings lead breakout is just one of them. They give you the biggest bang for your bucks.  My exhaustive study of all those who had triple digits kind of returns in a year at various time in their career shows that earnings was one of the basic foundation of their strategy. Mastering earnings is one of the best ways to beat the market handily.

TC2007 scans:
Stocks up 50% or more in a month
C20 >= 5 AND (AVGC20 * AVGV20) >= 2500 AND 100 * (C - C20) / C20 >= 50
Stocks up 25% or more in a month
C20 >= 5 AND (AVGC20 * AVGV20) >= 2500 AND 100 * (C - C20) / C20 >= 25
Stocks down 5% or more on high volume
( 100 * (C - C1) / C1) <= ( - 5) AND V >= 1000 AND V > V1
Stocks up 5% or more on high volume
( 100 * (C - C1) / C1) >= 5 AND V >= 1000 AND V > V1