
Steady breadth deterioration
October 12, 2016
In recent month there has been a steady breadth deterioration. You can see that in Market Monitor.
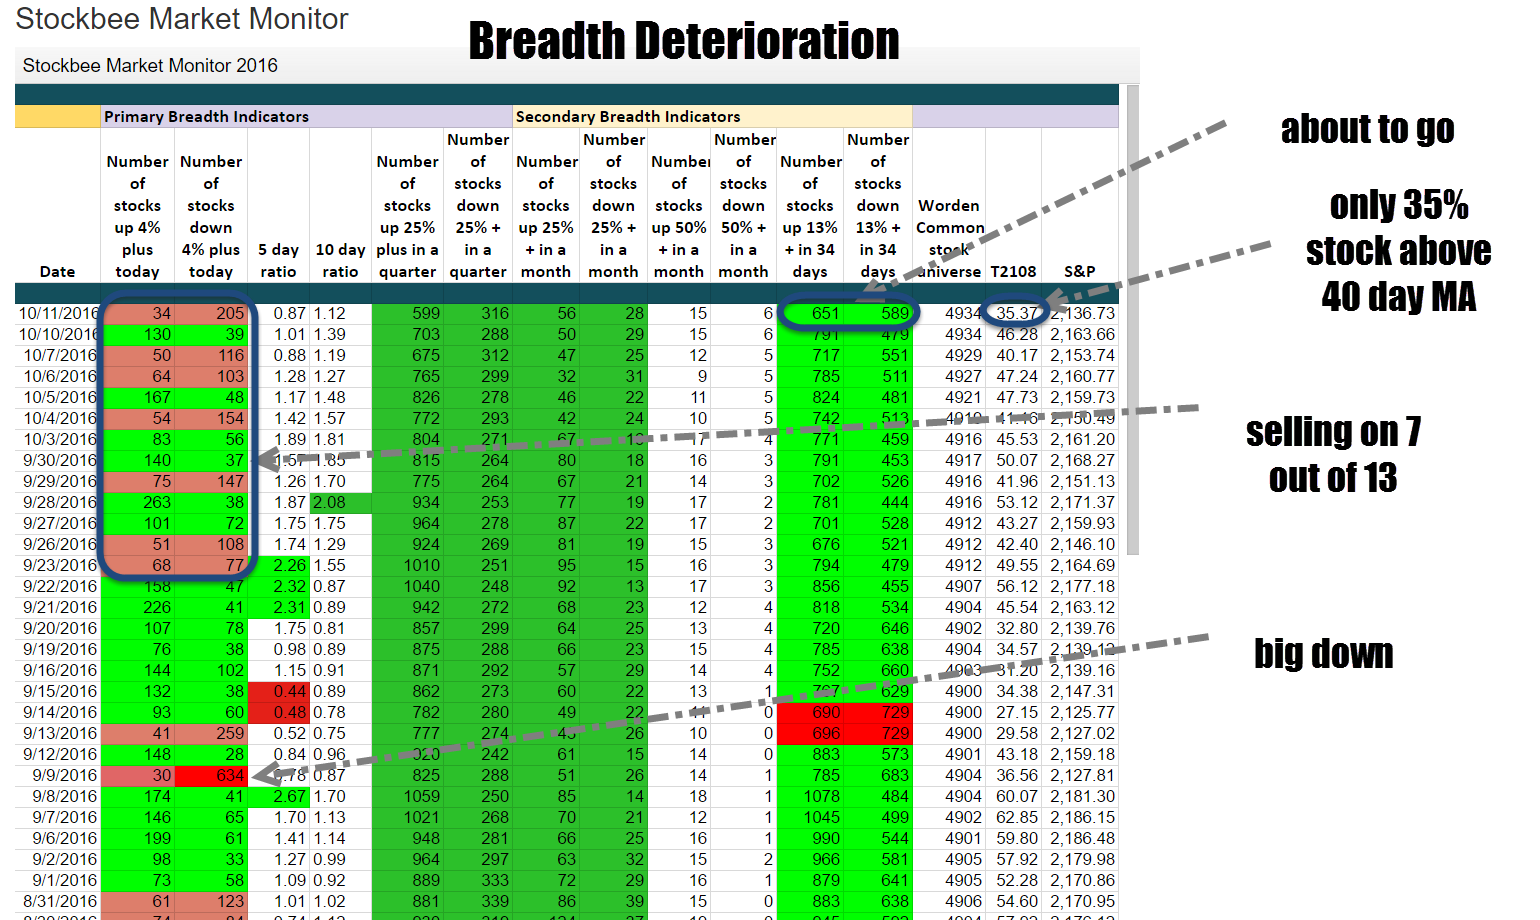
In last 13 days we have seen 7 negative breadth days. On 9/9/2016 we had a big 634 down day . That selling has not been followed by aggressive buying.
The T2108 Worden indicator peaked at 79.73% on 7/18/2016. Current it is at 35.37 which tells you only 1/3rd of the stock universe is above its 40 day moving average or in other words in uptrend.
This selling has been slow and not affected the indexes so much as they have been going sideways for months after an initial sharp bounce in July. The sideways action is also showing up in many stocks. If you see the anticipation scan , you will see several examples of that.

Breadth divergence and deterioration by itself is not fatal unless we get big selling and setup failures. As of now we do not see much of that.
No comments :
Post a Comment