
4/25/2024
4/23/2024
1/24/2024

1/23/2024
Miami Bootcamp May
Miami

- Price: $750 (cancellation fee $200) ( only for members)
- Date: May 24—26, 2024
- Time:Fri—Sat, 9:00 AM to 5:00 PM
Sun, 9:00 AM to 1:00 PM - Meals: Coffee, pastries and lunch
- Venue: Shalala Student Center
University of Miami
1/22/2024
1/15/2024
1/13/2024
Copenhagen Bootcamp in July


Dates and venue are confirmed for the Copenhagen Bootcamp
Date: July 5—7, 2024
Time: Fri—Sat, 9:00 AM to 5:00 PM, Sun, 9:00 AM to 1:00 PM
Seats: 40 ( Members only price $750)
Venue: Copenhagen Professional College - Sigurdsgade Campus (view on Google Maps)
1/11/2024
Examine your trading beliefs
You can only trade what you believe in.
Your beliefs drive your behavior. This is true not only of trading but also in real life. If you know a person's beliefs, you know how he will behave.
If you "believe " the markets are efficient and there is no way to make money by selecting stocks, you will go and buy ETF.
If you "believe" the only way to trade is using mechanical methods ( that is a belief) and discretionary trading is too vague (that is a belief), as a result, all your behavior will flow from it.
If you "believe," you should only trade triple ETF and not waste time on individual stocks (that is a belief), and as a result, all your behavior will flow from it.
If you "believe" that the only way to trade is with big risk and fully invested on margin, as a result, all your behavior will flow from it.
If you "believe" market will crash (it is a belief) you will spend time constantly shorting.
If you believe trading options is the path to big success (that is a belief), you will spend time trading options.
If you believe momentum stocks offer the best opportunities, you will trade them.
If you believe growth stocks offer biggest opportunities to profit from the growth you will build methods around your belief..
You will become a value investor if you believe growth investors are fools buying expensive companies.
If you believe stocks move in a momentum burst of 3 to 5 days, you will find ways to exploit that phenomenon.
If you "believe" barring liquid stocks, all other stocks are junk, you will only trade liquid stocks.
If you "believe" anticipation setup allows you to make money with the least amount of drawdowns, you will spend time trading them.
If you believe working people can not trade, then you will find a hundred reasons to justify your belief.
If you believe working people like you can still profitably trade, then you will find creative ways to find time for trading.
Every trade has deeply held beliefs like these.
The bundle of deeply held beliefs drives what kind of setup they will trade, what kind of timeframe they will trade, and also all elements of trade like entry, exit, risk, and number of positions held.
The beliefs determine where you will spend your efforts.
1/10/2024
How to deep dive daily
I am interested in trading the most explosive moves for the week or month. By studying these daily, you know the nature of moves in 5-day time frames.
If you want a hold period of one month, do this Deep dive for one month, six months, or a year, depending on your objective.

Just do one thing daily without fail.
Study stocks that are up 20% for a week and up 100% for a year
Everything you need to make money, you will learn from that.
You need to understand the nature of stock moves and how they start, progress, and reverse. Doing this daily will give you a working model of what works in the current market. Then, you can start designing the scans to find them.
This study will help you develop "your understanding " of market moves. Once you have sufficient experience of doing this, you can start discounting a lot of conventional wisdom or market speak. Because you can see what the Guru is telling you on Twitter in the book or in a blog, it is not in line with what actually happens in the market.
How can you do this
Run simple scans in Telechart
Study Bullish 20% c/c5>=1.2 and minv3.1>100000 and c>=5
Study Bearish 20% c/c5<.8 and minv3.1>100000 and c>=5
Study 20 Dollar plus Bullish c-c5>=20 and minv3.1>=100000
Study 20 Dollars plus bearish c5-c>=20 and minv3.1>=100000
If you are trading low-priced stocks, you can eliminate the last condition of c>=5
Do this daily, and you are guaranteed to be a better trader.
1/09/2024
JBLU U NN URNM


NVDA Day vs Swing vs Position Trade
1/08/2024
APLS, AVGO, FNGU, TREE and a Market monitor tip

APLS

FNGU

AVGO

TREE

Does Overhead resistance matter? (Video 2 min)
1/05/2024
For high win rate fix Situational Awareness
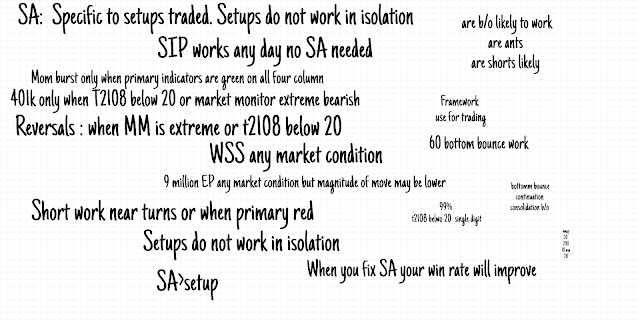
Every day, we do this to answer whether our setup is likely to work and only trade when the probability is in our favor for that setup.
Over the years over 10000 traders have learned. Situational Awareness and Market Monitor-based framework for trading, and you will see thousands of them on Twitter doing similar things.
If your trading is not going anywhere fix your Situational Awareness and you will find instant difference.
1/04/2024
.png)
12/31/2023
12/30/2023
12/20/2023
2024 Bootcamp Dates
2024 Bootcamp dates for those asking about the schedule
Members Only Online 19 to 21 January New Jersey 9 to 11 February ( members only) Cyprus 8 to 10 March (members only) Copenhagen 5 to 7 July (members only)Next year bootcamp schedule if busy
Become a member and attend one of the Stockbee BootCamps in 2024.
We have boot camps planned online, in New Jersey, Florida, Cyprus, Copenhagen, Buda Pest, and Las Vegas for 2024
Better late than never... my Bootcamp experience.
I've been a member since August 2021 and the North Brunswick Bootcamp is my first one. Since August 21 I've been in and out of trading, making every mistake on the book (yes, even flirting with different setups) but have been taking things pretty seriously this year. Being in the daily meetings, trying to develop my SA and so on. It has not been a great year for continuation setups, so I have not devoted 100% of my time to trading.
Going to a Bootcamp was quite an investment to me because I live in South America so the plane tickets are quite expensive. However, I pulled the trigger in November and bought the ticket for the NJ Bootcamp.
What I was looking for was quite clear to me: self-efficacy beliefs. I wanted to have the confidence to take larger size, being sure that I 'got' the setup right. I wanted to come back home excited to trade.
The experience was literally life-changing. I got everything I was looking for and more. Being someone that works form home and loves it, I had not considered the importance of social learning. EG is a great generous person that will go through your Deep Dive, answer questions and make sure that you don't go back home without understanding the setups. However, his commitment to everyone's success is crazy. The community that Pradeep has created is really a support system available to each and every member of the site. The incredible conversations I had at the Bootcamp had helped me clarify and re-clarify concepts that EG has been teaching us for years.
I'm back home and have daily conversations with people I met at the BC, constantly challenging our setup selection, exchanging opinions, and just basically lifting ourselves higher.
To finish my rant, if you're on the fence and you don't know whether the Bootcamp is worth it, make yourself a favor and go. I didn't know how alone I felt until I met other traders going through the same struggles.
And finally, a huge thanks to Pradeep for doing this, for challenging us but also for giving us the confidence we need to make this work. Trading is a journey (and a pretty long one for some of us) but having this community to lean on is what I think will make me successful in the long run.
Thank you to all the people I've met and exchanged opinions with, you've helped me tremendously. Social learning is the absolute best.
12/04/2023
Members feedback


As market conditions have improved, traders are benefitting from having sound setups and methods.
11/26/2023
How I calculate risk on a trade

11/11/2023
11/10/2023
11/07/2023
Stockbee North Brunswick Bootcamp December 8th to 10th.

Bootcamp North Brunswick, New Jersey ( only for members)
To be held at the Stockbee office in North Brunswick, NJ
Price: $750 (cancellation fee $200)
Date: December 8 - 10, 2023
Time: Fri—Sat, 9:00 am to 8:00 pm, SUN 9:00 am to 1:00 pm
Event size: Only 36 seats
Bootcamp Feedback Las Vegas

Tweet from CH
Posted on 4:07 PM Oct 22nd 2023


