
A series of fortunate set of coincidences helped me to develop one of the most profitable strategy within a year of starting trading. I started trading after the market had topped in 2000. During the hay days of market I was busy running a start up company. After the company closed down I had applied for couple of Ph D programmes and had time till the courses would start. So I got in to trading.
Like most traders at the beginning of trading career I was clueless. Any approach was appealing. The way the entire universe of trading ideas are structured there is an over abundance of books on technical analysis. 90% of he books in Barnes and Noble investing section are about technical analysis. So I was going through hundreds of tomes on technical analysis and candlestick charting. It was not doing much to my trading performance. I was lost in the technical analysis jungle.
While still struggling with the market I was hunting for a database on historical data on the market. Through the couple of sources I managed to land 40 years of historical financial plus trading data on stocks.( that time I did not know of things like Bloomberg) Due to my previous jobs I had some understanding of data mining and other statistical techniques. So I started playing around with the data. The data had things like earning date, earnings, and all other balance sheet related stuff.
While I was playing around with the data, there was a large pile of non technical analysis related books I had on my pending reading list. One of the book was Frank Cappiello's New Guide to Finding the Next Superstock .( the book sells for $0.01 on Amazon now!!!!). The book talked about growth stocks which had out sized earning growth for extended period of time and how to identify such stocks. The concept sounded appealing and logical. So I started looking at more books on that topic and the recurring theme in all of them was earning growth. So I started crunching data for earning and price growth. I found what most others also know that earnings lead to price growth. But I also found other things like what happens when suddenly growth accelerates, or how does price behave post and pre earnings. So that was a eureka moment.
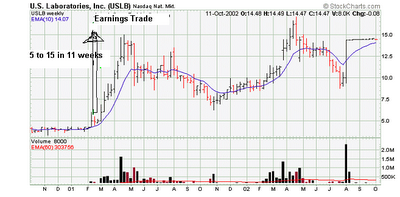
Armed with this insight I was all ready to put it in to practice next week. As luck would have it , it was earning season. The first company I noticed with a significant earning growth was US Laboratories (USLB). The day the earnings came it started moving and I just dived right in , pyramided in to it and rode it all the way to triple digit growth.( I had no fear, no money management insights at that stage.)
Now all this in the middle of furious bear market. I found a couple of other companies like BDY (which had a symbol of BPRX that time ), DYII and MTON ( which is INFO) now. All had common character a huge earning growth in the quarter and they started rallying the day earnings came.
In my experience when you experiment with a strategy and if it becomes profitable immediately you are more likely to use it. Now that requires some luck. As in this case my finding an insight happen to coincide with it being an earning season and it leading to am immediately profitable trade.
Over the next 5 years I have perfected the strategy and now know lot of others also follow the same strategy. It essentially works best on unknown stocks. These stocks have no analyst, no forward guidance, no newsletter following them. Most of them are thinly traded before they get discovered. During every earning season you will notice at least 20 stocks like this. They go on to make any where between 50% to 300% or more move in few months post their earnings. Some of them gap up 20 o 50% or more on earning days and just keep going. The best ones do not offer any opportunity to enter on pullback. You have to pull the trigger on day of earnings itself. Some of them are just one earning season wonder, some continue to show that type of growth and as a result become 10 baggers like NTRI or HANS.
Earnings is not the only thing which I have found which drives price leap after earnings. In some cases it is significant increase in sales. In these kind of companies there are losses but sales are growing rapidly and they act similar to the earnings plays post earnings. Recent examples of this was XMSR.
Data Mining and using statistical tools is wonderful tool to find such new insights in to market behavior. Lot of it depends on how you approach it and what you find out of it is also a function of what is the paradigm you are using. I have seen lot of data mining being used to find small edges for short duration trades. Brett Steenbarger at Traderfeed is one blog which clearly uses data mining to find tradable patterns. But the predominant paradigm he is looking for is short term patterns and more suitable for day trades or trades of few day duration.
If you change the paradigm and look for longer duration trade ideas, you will find many edges through data mining. Over the years I have discovered 4-5 such longer duration edges through data mining. Some day I will talk about "Why I love virgins" one of the strategies I found through data mining. Almost all strategies I trade are based on such data mining insight and I am primarily a medium term holding period kind of trader.
Over the years I have found lot of supporting books and articles which essentially use a similar strategy or variation of it. There are large number of mutual funds and other institutions which also use similar approach, as I have tracked institutional ownership on such plays.
Fortunately we are at the beginning of a new earning season and there will be lot of opportunities like this in this season. The concept is simple to find unknown stocks having significant earnings or sales acceleration for first time. Executing it requires data base access and some tactical fine tuning. If you want to go down this path there are couple of books which discuss similar things and will give you a better grasp on how to put this in practice.
Frank Cappiello's New Guide to Finding the Next Superstock
The Best: TradingMarkets.com Conversations With Top Traders
Superperformance stocks
The Hedge Fund Edge
Paradigms
Here is a fun exercise to help you discover some of these stocks. There are three databases one from 2002 (bear market) one from 2005(bull market) and one from last few months. You can track the earnings date, % changes in earnings and sales and price changes post earning. Some of the stock triggered trade, some did not. But the exercise will give you enough clues to escape from technical analysis jungle. Be careful you may get lost in data mining jungle.
2002
BLUD BYD CACH CAO CENT CHTT
CLHB CRMT GLG HGR HOV IRN
JAH JCOM JOSB MIK MPX MTH
NEW NFI NVR NWRE PETM SCSS
SHRP SIE SPAR TSCO TXCO UNTD
USNA
2005
AAPL ALY AMIE AMN APLX ARBA ARD
ARS ARTG ATI ATRO BITS BMR BTJ
CAS CECE CELG CFK CNQR CRM CTRN
CYBS DEL DO DRQ EMCI ENN FALC
FCX FRGB GFX GG GLBL GLG GMXR
GOOG GROW GV HANS HLND HOLX HSOA
ICCA ICTG IDCC IFOX ISRG IVAC JRVR
KG KNOT KNXA KVHI LGTY LIFC LVS
MEK MERX MLR MNRK MOSS MPW MTRX
MWIV NDAQ NETL NGA NGPS NMRX NRF
NRVN NTG NTRI NVDA NYM OYOG RAIL
RBC RG RNOW RNWK RTI STEC STEL
STRS SWS TBBK TFN TIE TIII TRN
TTI TWGP UPL USAP WHQ WPCS WPZ
WVVI ZUMZ
Sept 2006 (How many of these recent rallies were triggered by earnings?)
AKAM ANOR APN AVNC BIOV CBEY
CHDX CLEC CPY DGIT IAAC INPH
LBIX MWRK NVEC OLAB PCCC SIM
STEC SWHC SYX TAR TATTF TRT UAHC
"From concept to execution". Pointers on how to put this concept in practice.
Related posts in this series:
Earnings Season- Time to be very careful...
Earnings and Dan Zanger
Earning Surprise System for $1495
Trading Earnings Breakouts
Earnings Acceleration- Long Term Impact
Trading Earnings Breakout -Part1
Trading Earnings Breakouts -Part2
Trading Earnings Breakouts -Part3
Like most traders at the beginning of trading career I was clueless. Any approach was appealing. The way the entire universe of trading ideas are structured there is an over abundance of books on technical analysis. 90% of he books in Barnes and Noble investing section are about technical analysis. So I was going through hundreds of tomes on technical analysis and candlestick charting. It was not doing much to my trading performance. I was lost in the technical analysis jungle.
While still struggling with the market I was hunting for a database on historical data on the market. Through the couple of sources I managed to land 40 years of historical financial plus trading data on stocks.( that time I did not know of things like Bloomberg) Due to my previous jobs I had some understanding of data mining and other statistical techniques. So I started playing around with the data. The data had things like earning date, earnings, and all other balance sheet related stuff.
While I was playing around with the data, there was a large pile of non technical analysis related books I had on my pending reading list. One of the book was Frank Cappiello's New Guide to Finding the Next Superstock
Armed with this insight I was all ready to put it in to practice next week. As luck would have it , it was earning season. The first company I noticed with a significant earning growth was US Laboratories (USLB). The day the earnings came it started moving and I just dived right in , pyramided in to it and rode it all the way to triple digit growth.( I had no fear, no money management insights at that stage.)

Now all this in the middle of furious bear market. I found a couple of other companies like BDY (which had a symbol of BPRX that time ), DYII and MTON ( which is INFO) now. All had common character a huge earning growth in the quarter and they started rallying the day earnings came.
In my experience when you experiment with a strategy and if it becomes profitable immediately you are more likely to use it. Now that requires some luck. As in this case my finding an insight happen to coincide with it being an earning season and it leading to am immediately profitable trade.
Over the next 5 years I have perfected the strategy and now know lot of others also follow the same strategy. It essentially works best on unknown stocks. These stocks have no analyst, no forward guidance, no newsletter following them. Most of them are thinly traded before they get discovered. During every earning season you will notice at least 20 stocks like this. They go on to make any where between 50% to 300% or more move in few months post their earnings. Some of them gap up 20 o 50% or more on earning days and just keep going. The best ones do not offer any opportunity to enter on pullback. You have to pull the trigger on day of earnings itself. Some of them are just one earning season wonder, some continue to show that type of growth and as a result become 10 baggers like NTRI or HANS.
Earnings is not the only thing which I have found which drives price leap after earnings. In some cases it is significant increase in sales. In these kind of companies there are losses but sales are growing rapidly and they act similar to the earnings plays post earnings. Recent examples of this was XMSR.
Data Mining and using statistical tools is wonderful tool to find such new insights in to market behavior. Lot of it depends on how you approach it and what you find out of it is also a function of what is the paradigm you are using. I have seen lot of data mining being used to find small edges for short duration trades. Brett Steenbarger at Traderfeed is one blog which clearly uses data mining to find tradable patterns. But the predominant paradigm he is looking for is short term patterns and more suitable for day trades or trades of few day duration.
If you change the paradigm and look for longer duration trade ideas, you will find many edges through data mining. Over the years I have discovered 4-5 such longer duration edges through data mining. Some day I will talk about "Why I love virgins" one of the strategies I found through data mining. Almost all strategies I trade are based on such data mining insight and I am primarily a medium term holding period kind of trader.
Over the years I have found lot of supporting books and articles which essentially use a similar strategy or variation of it. There are large number of mutual funds and other institutions which also use similar approach, as I have tracked institutional ownership on such plays.
Fortunately we are at the beginning of a new earning season and there will be lot of opportunities like this in this season. The concept is simple to find unknown stocks having significant earnings or sales acceleration for first time. Executing it requires data base access and some tactical fine tuning. If you want to go down this path there are couple of books which discuss similar things and will give you a better grasp on how to put this in practice.
Frank Cappiello's New Guide to Finding the Next Superstock
The Best: TradingMarkets.com Conversations With Top Traders
Superperformance stocks
The Hedge Fund Edge
Paradigms
Here is a fun exercise to help you discover some of these stocks. There are three databases one from 2002 (bear market) one from 2005(bull market) and one from last few months. You can track the earnings date, % changes in earnings and sales and price changes post earning. Some of the stock triggered trade, some did not. But the exercise will give you enough clues to escape from technical analysis jungle. Be careful you may get lost in data mining jungle.
2002
BLUD BYD CACH CAO CENT CHTT
CLHB CRMT GLG HGR HOV IRN
JAH JCOM JOSB MIK MPX MTH
NEW NFI NVR NWRE PETM SCSS
SHRP SIE SPAR TSCO TXCO UNTD
USNA
2005
AAPL ALY AMIE AMN APLX ARBA ARD
ARS ARTG ATI ATRO BITS BMR BTJ
CAS CECE CELG CFK CNQR CRM CTRN
CYBS DEL DO DRQ EMCI ENN FALC
FCX FRGB GFX GG GLBL GLG GMXR
GOOG GROW GV HANS HLND HOLX HSOA
ICCA ICTG IDCC IFOX ISRG IVAC JRVR
KG KNOT KNXA KVHI LGTY LIFC LVS
MEK MERX MLR MNRK MOSS MPW MTRX
MWIV NDAQ NETL NGA NGPS NMRX NRF
NRVN NTG NTRI NVDA NYM OYOG RAIL
RBC RG RNOW RNWK RTI STEC STEL
STRS SWS TBBK TFN TIE TIII TRN
TTI TWGP UPL USAP WHQ WPCS WPZ
WVVI ZUMZ
Sept 2006 (How many of these recent rallies were triggered by earnings?)
AKAM ANOR APN AVNC BIOV CBEY
CHDX CLEC CPY DGIT IAAC INPH
LBIX MWRK NVEC OLAB PCCC SIM
STEC SWHC SYX TAR TATTF TRT UAHC
"From concept to execution". Pointers on how to put this concept in practice.
Related posts in this series:
Earnings Season- Time to be very careful...
Earnings and Dan Zanger
Earning Surprise System for $1495
Trading Earnings Breakouts
Earnings Acceleration- Long Term Impact
Trading Earnings Breakout -Part1
Trading Earnings Breakouts -Part2
Trading Earnings Breakouts -Part3
No comments :
Post a Comment