
Market Monitor Scans
August 15, 2018
Market Monitor Scans : Version 1.1
All the scans used in Market Monitor Spreadsheet updated for latest version of Telechart.
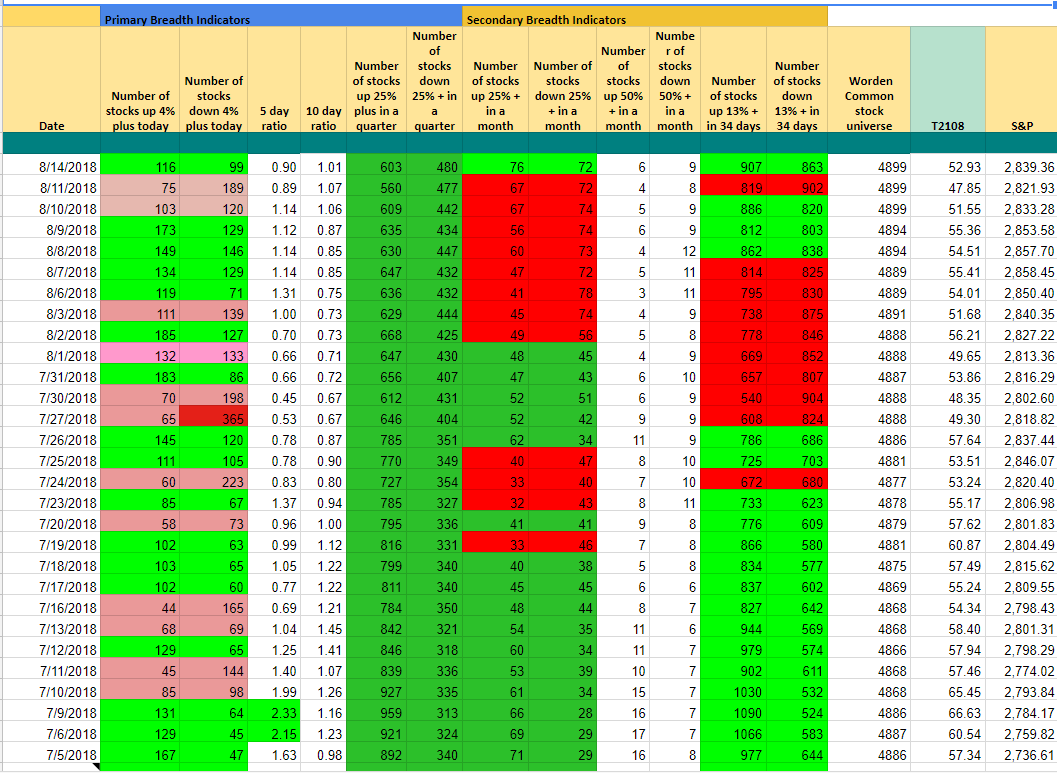
Number of stocks up 4% plus today

Number of stocks down 4% plus today

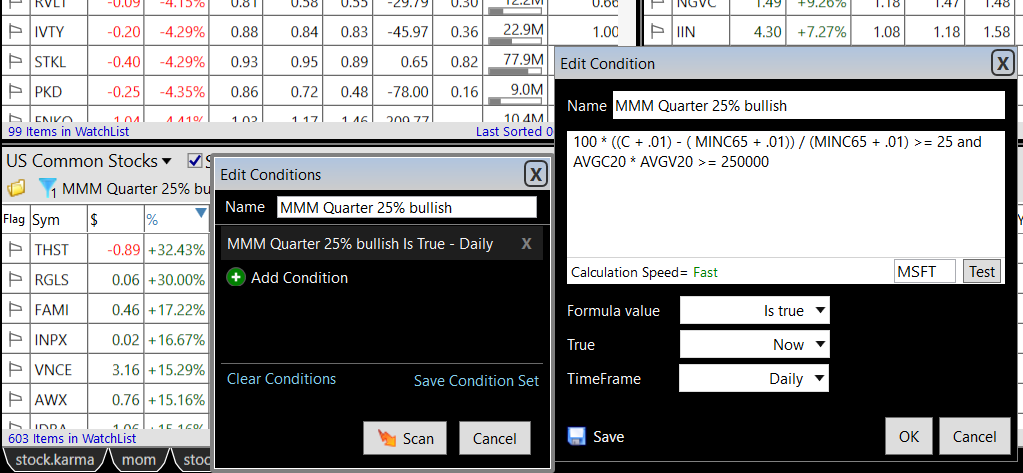
Number of stocks up 25% plus in a quarter
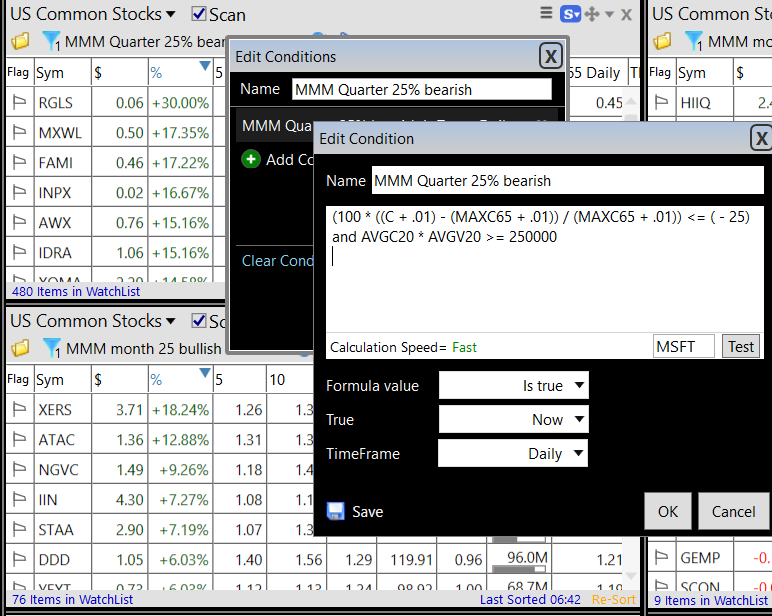
Number of stocks down 25% plus in a quarter
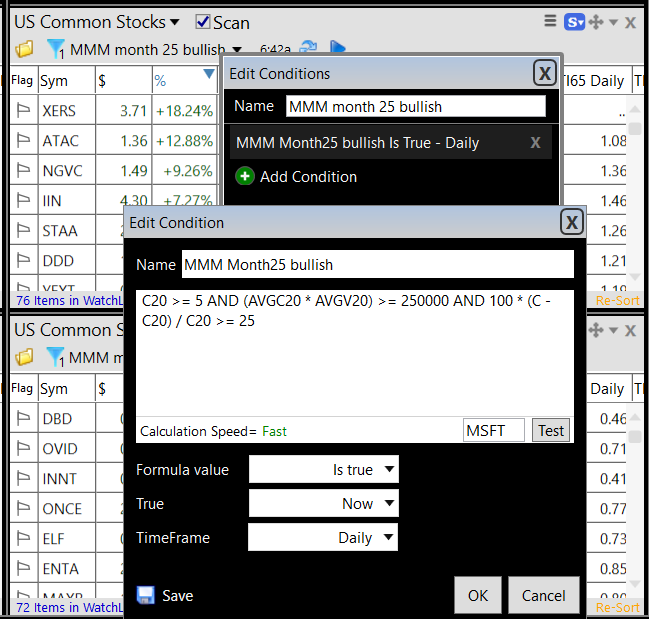
Number of stocks up 25% plus in a month
Number of stocks down 25% plus in a month
Number of stocks up 50% plus in a month

Number of stocks down 50% plus in a month

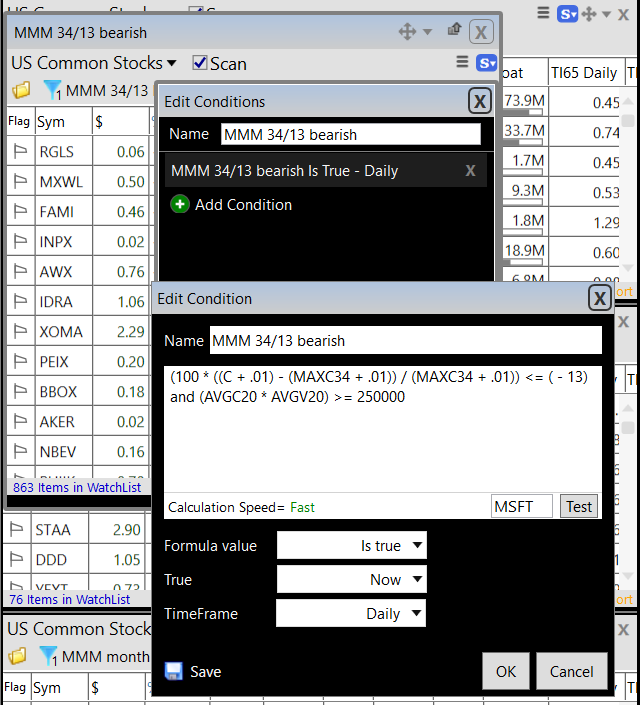
Number of stocks up 13% plus in a 34 days

Number of stocks down 13% plus in a 34 days
Market Monitor Layout

Hi Pradeep,
ReplyDeleteAny chance you post an article or a video to explain how to make best use of MM?
Thank you.
Tonio.
Hello Stockbee,
ReplyDeleteCould you please check the posted formula for # stocks down 4% in a day (c/c1>.96...)? It does not seem to be provided the desired output. Thx.
the scan is right, it is not c/c1>.96 it it c/c1<=.96
ReplyDeleteWith the v1.1 code, I've been able to successfully replicate all of the columns except for the 25% up/down in a quarter. Whether I use adjusted or non-adjusted historical data, my own Operating Companies Only (cleaner than Telechart's) or Telechart's exported common only watchlist, the number of stocks passing is an order of magnitude of difference. It may not matter for detecting the primary trend (?) but the extreme points (e.g. <200) won't show up. This is very frustrating. Any ideas?
ReplyDeletehttps://i.postimg.cc/hGLQVFPt/screenshot-2019-01-16-at-07-22-57.png
https://i.postimg.cc/KzVbzjSk/screenshot-2019-01-16-at-07-24-14.png
Almos forgot, here's the code I'm using:
ReplyDeleteUQ25 = (100 * ((C + .01) - ( Min(C,65) + .01 )) / (Min(C,65)+.01)) >= 25 AND MA(C,20)*MA(V,20) >= 250000;
DQ25 = (100 * ((C + .01) - ( Max(C,65) + .01 )) / (Max(C,65)+.01)) <= (-25) AND MA(C,20)*MA(V,20) >= 250000;
I use
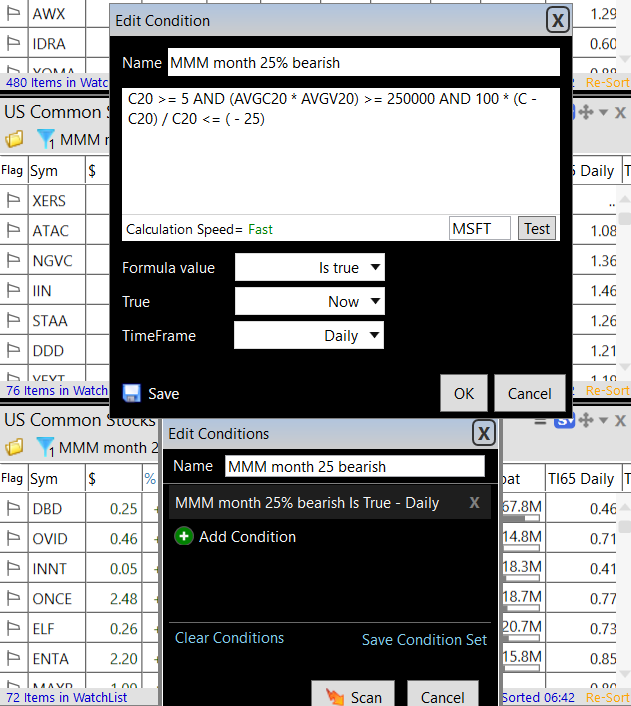
ReplyDeleteBullish 100 * ((C + .01) - ( MINC65 + .01)) / (MINC65 + .01) >= 25 and AVGC20 * AVGV20 >= 250000
Bearish (100 * ((C + .01) - (MAXC65 + .01)) / (MAXC65 + .01)) <= ( - 25) and AVGC20 * AVGV20 >= 250000
you can instead use T2108. Readings below 10 act in similar manner
Problem was in not translating TC2000's MIN/MAX function properly. Doh!
ReplyDeleteThanks for the tip about T2108. Good to have secondary confirmaton.
How is the new 5-day ratio to be used?
It tells you when breadth thrust is happening when it is above 2.
ReplyDelete