
Market Monitor signalled this pullback few days ago
November 13, 2015
Extreme readings on stocks up 50% plus in a month lead to market pullbacks. The following image chart you that.
yellow arrows show when 50% is => 20 stocks
red / green histogram is the primary indicator difference ( difference between column 6 and 7 in Market Monitor.)
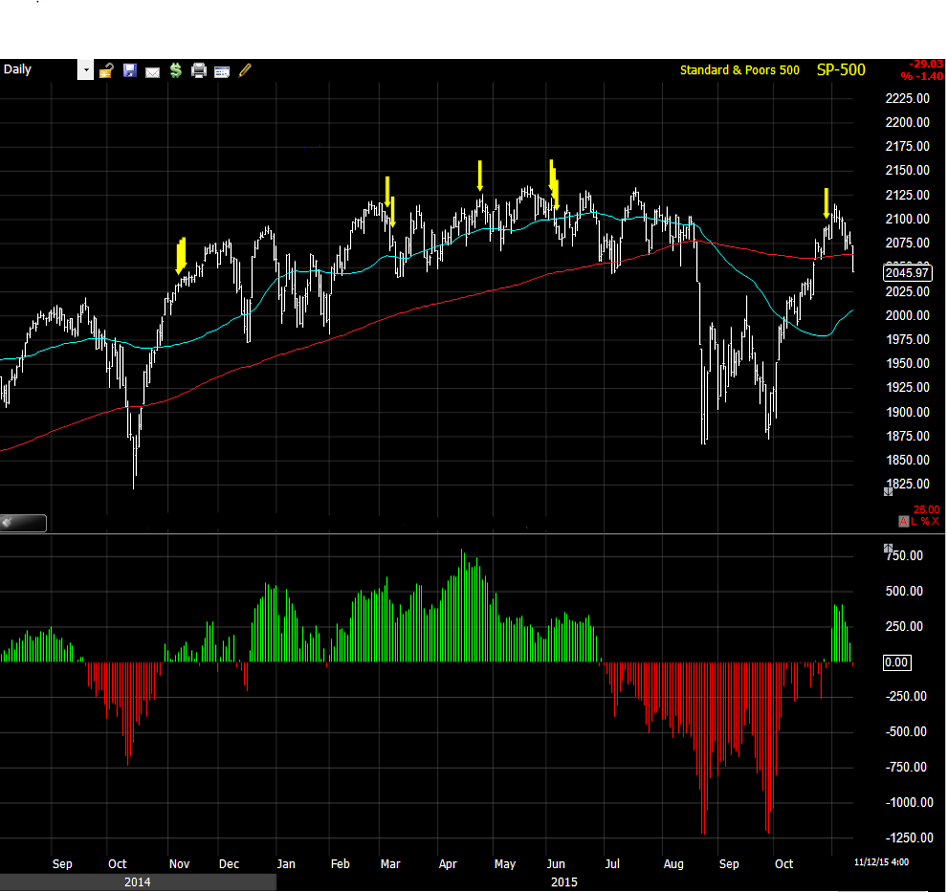
As you can see the readings lead to a pullback in few days or weeks. So when readings get above 20 you need to calibrate your trading accordingly.
The readings on stocks up 50% plus in a month went above 20 on 10/29/15 as you can see below:

Being proactive is better with this indicator as things look extremely good when the readings are near 20 and then a pullback develops.
Breadth can help you lower drawdowns and improve your returns once you understand how to use it.
No comments :
Post a Comment