
Understanding the nature of a 20% move in less than a week will give you an edge.
December 3, 2022

Understanding the nature of a 20% move in less than a week will give you an edge.
To understand the 20% move keep aside all your current thinking, charts, indicator, MA, and stock phases. Start with a completely blank mindset.
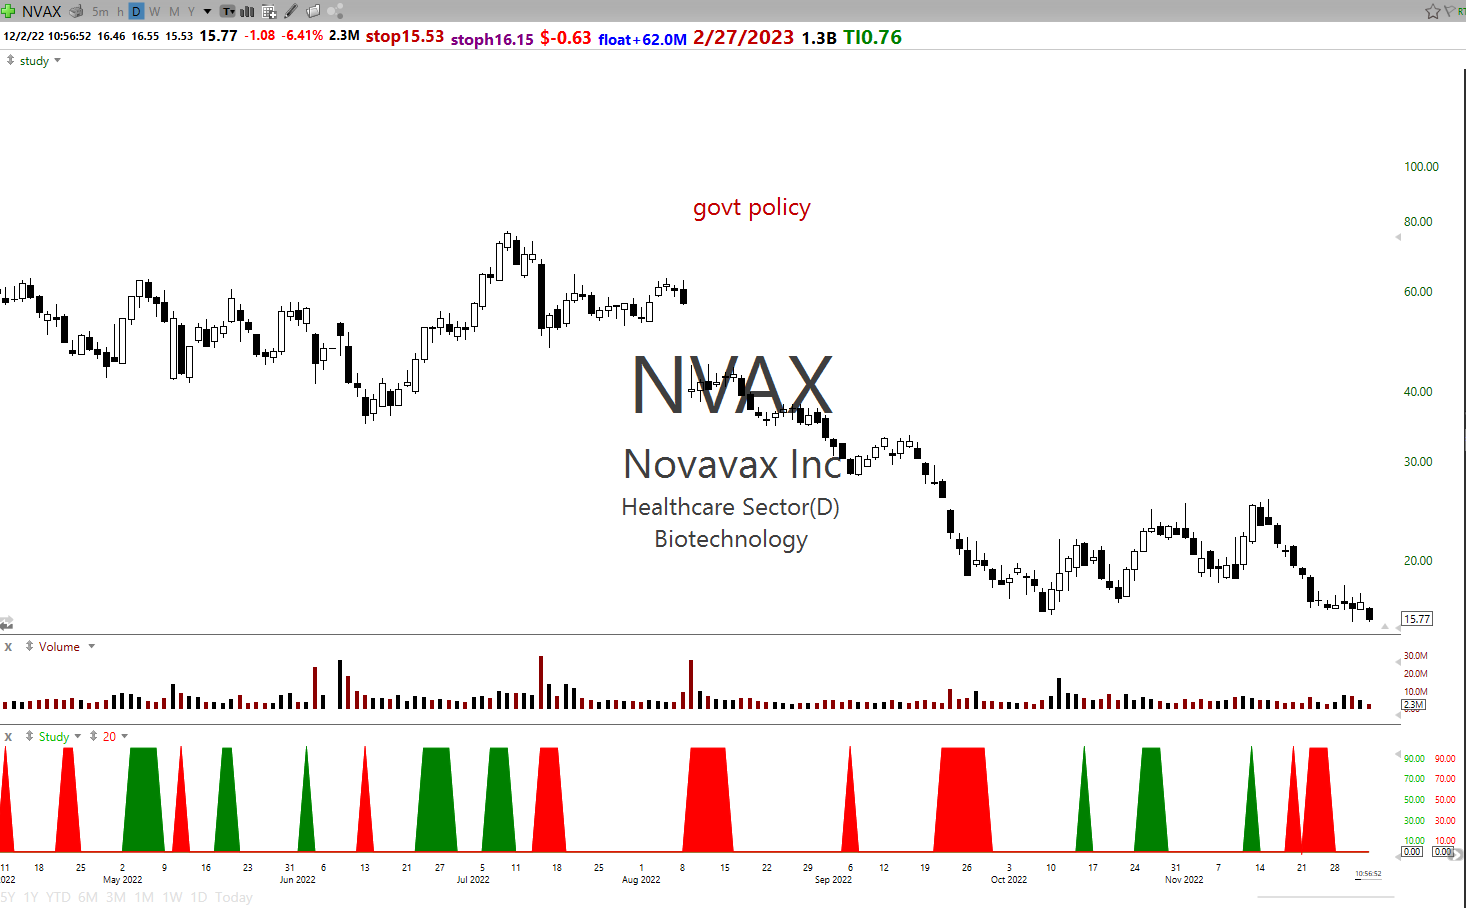
Mark on the chart the 20% move using the following PCF
https://www.tc2000.com/~tSzZPq
c/c5>=1.2 and minv3.1>100000 and c>=3 bullish
c/c5=<.80 and minv3.1>100000 and c>=5 bearish
This is how the chart will look.
Now study 500 to 1000 stocks with just this indicator on it.
Write down your observations.
https://stockbee.biz/tweet/602204/
https://stockbee.biz/tweet/602292/
https://stockbee.biz/tweet/602293/
https://stockbee.biz/tweet/602295/
https://stockbee.biz/tweet/602301/
https://stockbee.biz/tweet/602302/
When is use this formula in TC2000 nothing comes up.
ReplyDeleteEven when I use your link and i have exact study chart you created on my screen it doesnt work.
It simply doesn't show the green and red spikes in the bottom as it's supposed to do.
Any suggestions?
set it up manually
ReplyDeleteWhen i enter your formula into the formula section and test it, it says ''ERROR: Must not be a boolean formula''
ReplyDeleteIt does this with both the bullish and the bearish one.
Have also tried to set it up manually like you suggested before.
if you are in Europe you will need to make changes
ReplyDeleteYes i am in Europe but why does the formula have to different?
ReplyDeleteIts still the same program and stock market?
Found out i used the wrong indicator. I am now using the ''Custom PFC % True indicator''.
ReplyDeleteBut when i put in the formula and i test it, it says the value = false.
Therefore it doesnt show anything. I have now tired multiple ways of writing the formula but without any luck