OMAB @ 15.02 - next day the market would have had you wiped out. How you choose right entry point and how many times you try to entry before you quit with this stock?
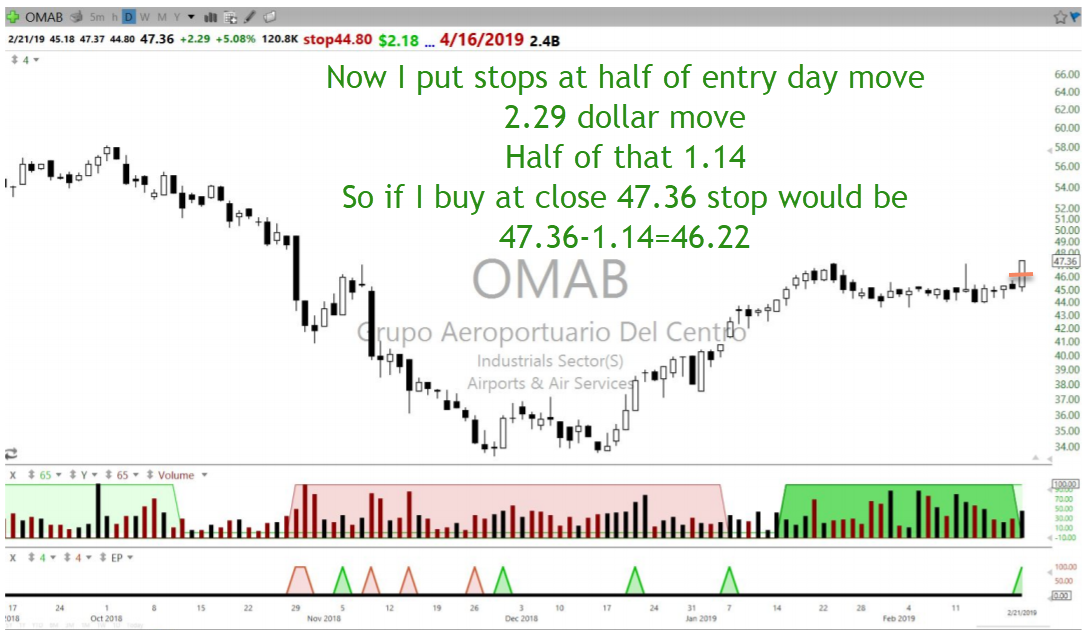
I am not sure what your scan is calculating and how it is calculating and how accurate the data is. My position is still open and in profit and 46.22 has not been hit (so why it shows red bar in your scan)
The reason it shows red bar is your calculations have an error (after looking at your code you can figure that out). It is calculating half of day ago h-l price , which is not same as high-low of entry day.
At any given time you buy there is always H and L set for that time periods. In your code you are calculating it for previous day as a result it is giving you wipeout days wrong.


and % winners/losers is a lot less now? thanks
ReplyDeleteyes but that is not entirely due to stops. Anticipation breakout and earlier entries , identifying and entering b/o earlier has also lot to do with it
ReplyDeleteis this how you catch the 'real' b/o and ignore the fake b/o? you don't care about the whipsaw at all?
ReplyDeleteNo matter what you do some breakouts will whipsaw. That is part of the game.
ReplyDeleteOMAB @ 15.02 - next day the market would have had you wiped out. How you choose right entry point and how many times you try to entry before you quit with this stock?
ReplyDeleteThe stop has not been hit. Stock is up next day. Not sure why would it wipe me out.
ReplyDeleteRed boxes - wipe out days
ReplyDeletehttp://charts.stockfetcher.com/sfchart/rQFzcpd43U.png
Stockfetcher code:
Symlist(omab)
set{varh, high 1 day ago}
set{varl, low 1 day ago}
set{hl, varh - varl}
set{fifty, hl / 2}
set{stop, open - fifty}
set{upa, count(low is below stop,1)}
Draw upa
I am not sure what your scan is calculating and how it is calculating and how accurate the data is. My position is still open and in profit and 46.22 has not been hit (so why it shows red bar in your scan)
ReplyDeleteThe reason it shows red bar is your calculations have an error (after looking at your code you can figure that out). It is calculating half of day ago h-l price , which is not same as high-low of entry day.
ReplyDeletehow do you calculate half bar point the day you buy? H and L are not set.thanks
ReplyDeleteAt any given time you buy there is always H and L set for that time periods. In your code you are calculating it for previous day as a result it is giving you wipeout days wrong.
ReplyDelete